Home > Science > Biology > Genetics > Population Genetics > Heterozygosity > Figure 12
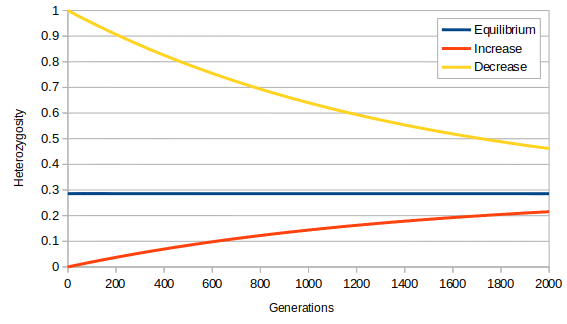
A plot of the predicted change in heterozygosity over time approaching an equilibrium value. In order to make it easier to plot a small population size, N = 1000, and high mutation rate, μ = 10-4, were used for illustration. The ODS spreadsheet used to generate this plot can be downloaded using this link.
Floyd A. Reed, January 16, 2021