Difference between revisions of "File:Variablegrowthrates.png"
(This is used to illustrate Haldane's (1937) statement about average fitness over time and the effects of variation in fitness. A starting number of 100 is used in each case. "Growth 1" uses fitnesses of 0.6 0.1 1.1 2.1 1.6 each time step (multiplied...) |
|||
| Line 24: | Line 24: | ||
1.2 | 1.2 | ||
over time, with the same arithmetic mean, 1.1, but a smaller variance in fitness over time (0.095 versus 0.625) results in a greater number at the end (the equivalent of a geometric mean of ~1.0636). | over time, with the same arithmetic mean, 1.1, but a smaller variance in fitness over time (0.095 versus 0.625) results in a greater number at the end (the equivalent of a geometric mean of ~1.0636). | ||
| + | |||
| + | Image made using LibreOffice Calc. | ||
Latest revision as of 01:48, 10 September 2018
This is used to illustrate Haldane's (1937) statement about average fitness over time and the effects of variation in fitness.
A starting number of 100 is used in each case. "Growth 1" uses fitnesses of 0.6 0.1 1.1 2.1 1.6 each time step (multiplied by the population number). "Growth 2" is 1.1 1.6 0.6 2.1 0.1 and "Growth 3 is 1.6 2.1 0.1 0.6 1.1. These all consist of the same numbers but in different orders and have an arithmetic mean of 1.1. However, if a fitness of 1.1 is applied consistently the end result is much higher. A geometric mean, corresponding to ~0.74, is an accurate way to represent a time-averaged fitness (or rate of growth).
For comparison a curve, with fitnesses 1.2 0.7 1.5 0.9 1.2 over time, with the same arithmetic mean, 1.1, but a smaller variance in fitness over time (0.095 versus 0.625) results in a greater number at the end (the equivalent of a geometric mean of ~1.0636).
Image made using LibreOffice Calc.
File history
Click on a date/time to view the file as it appeared at that time.
| Date/Time | Thumbnail | Dimensions | User | Comment | |
|---|---|---|---|---|---|
| current | 01:47, 10 September 2018 | 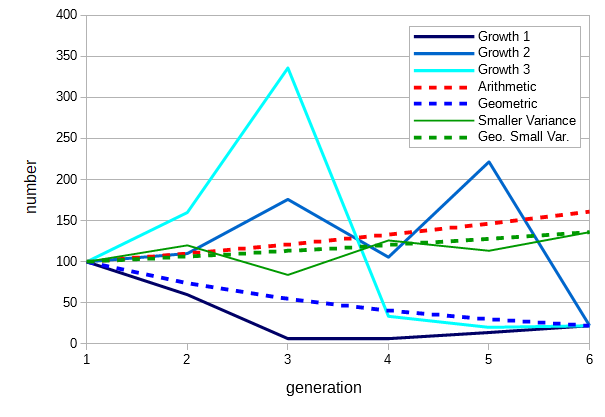 | 605 × 417 (30 KB) | Floyd (talk | contribs) | This is used to illustrate Haldane's (1937) statement about average fitness over time and the effects of variation in fitness. A starting number of 100 is used in each case. "Growth 1" uses fitnesses of 0.6 0.1 1.1 2.1 1.6 each time step (multiplied... |
- You cannot overwrite this file.
File usage
The following 2 pages link to this file: