Séralini et al. 2012
Citation
Séralini, G. E., Clair, E., Mesnage, R., Gress, S., Defarge, N., Malatesta, M., ... & De Vendômois, J. S. (2012). RETRACTED: Long term toxicity of a Roundup herbicide and a Roundup-tolerant genetically modified maize.
Links
- https://www.sciencedirect.com/science/article/pii/S0278691512005637
- https://www.ncbi.nlm.nih.gov/pubmed/27752412
- https://en.wikipedia.org/wiki/S%C3%A9ralini_affair
- http://hawaiireedlab.com/pdf/s/séralinietal2012.pdf (internal lab link only)
Published Abstract
BACKGROUND
The health effects of a Roundup-tolerant NK603 genetically modified (GM) maize (from 11% in the diet), cultivated with or without Roundup application and Roundup alone (from 0.1 ppb of the full pesticide containing glyphosate and adjuvants) in drinking water, were evaluated for 2 years in rats. This study constitutes a follow-up investigation of a 90-day feeding study conducted by Monsanto in order to obtain commercial release of this GMO, employing the same rat strain and analyzing biochemical parameters on the same number of animals per group as our investigation. Our research represents the first chronic study on these substances, in which all observations including tumors are reported chronologically. Thus, it was not designed as a carcinogenicity study. We report the major findings with 34 organs observed and 56 parameters analyzed at 11 time points for most organs.
RESULTS
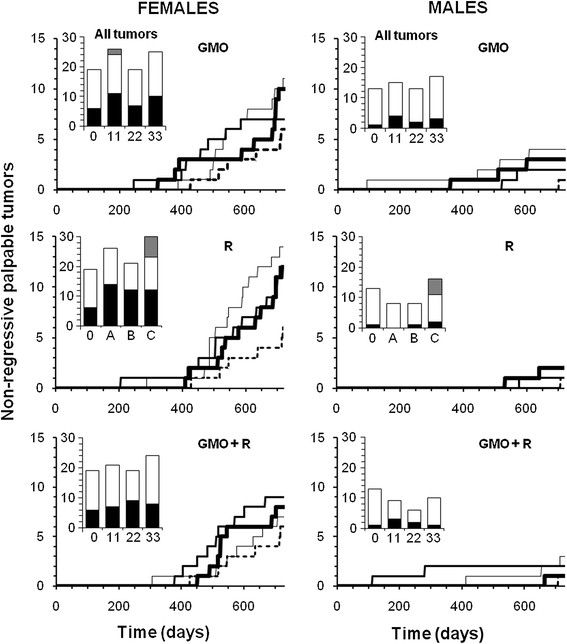
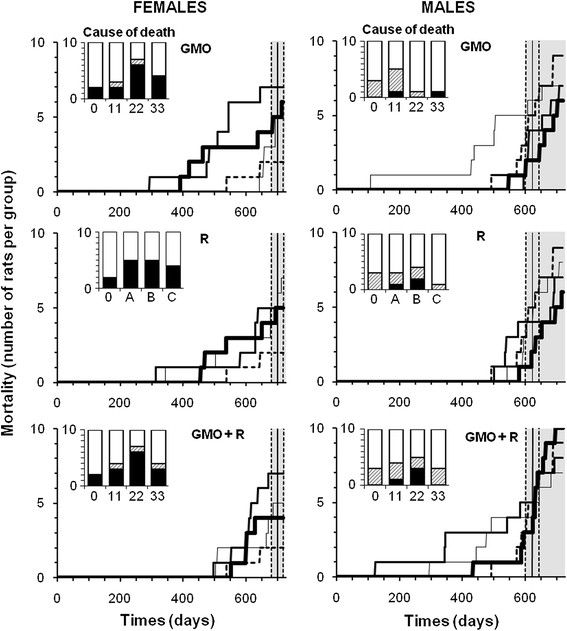
Biochemical analyses confirmed very significant chronic kidney deficiencies, for all treatments and both sexes; 76% of the altered parameters were kidney-related. In treated males, liver congestions and necrosis were 2.5 to 5.5 times higher. Marked and severe nephropathies were also generally 1.3 to 2.3 times greater. In females, all treatment groups showed a two- to threefold increase in mortality, and deaths were earlier. This difference was also evident in three male groups fed with GM maize. All results were hormone- and sex-dependent, and the pathological profiles were comparable. Females developed large mammary tumors more frequently and before controls; the pituitary was the second most disabled organ; the sex hormonal balance was modified by consumption of GM maize and Roundup treatments. Males presented up to four times more large palpable tumors starting 600 days earlier than in the control group, in which only one tumor was noted. These results may be explained by not only the non-linear endocrine-disrupting effects of Roundup but also by the overexpression of the EPSPS transgene or other mutational effects in the GM maize and their metabolic consequences.
CONCLUSION
Our findings imply that long-term (2 year) feeding trials need to be conducted to thoroughly evaluate the safety of GM foods and pesticides in their full commercial formulations.
Notes
Republished as Séralini et al. 2014.
I plan to write a more detailed discussion of these results, but do not have time at the moment. Long story short I do not think the results back up the claims made. I use this paper as a teaching tool in my undergraduate genetics class (how to read these graphs and evaluate the results, with more background information than what is here at the moment).
Published caption: "Figure 4 Largest non-regressive tumors in rats fed GMO treated or not by Roundup andeffects of Roundup alone. Rats were fed with NK603 GM maize (with orwithout application of Roundup) at three different doses (11%, 22%, and 33% intheir diet; thin, medium, and bold lines, respectively) compared to thesubstantially equivalent closest isogenic non-GM maize (control, dotted line).Roundup was administered in drinking water at three increasing doses, samesymbols, environmental (A), MRL in some agricultural GMOs (B),and half of minimal agricultural levels (C), see ‘Methods’).The largest tumors were palpable during the experiment and numbered from 20 mmin diameter for males and 17.5 mm for females. Above this size, 95% of growthswere non-regressive tumors. Summary of all tumors are shown in the barhistograms: black, non-regressive large tumors; white, small internal tumors;grey, metastases."
Published caption: "Figure 6 Mortality of rats fed GMO treated or not with Roundup and effects of Roundupalone. The symbols of curves and treatments are explained in the captionof Figure 4. Lifespan during the experiment for thecontrol group is represented by the vertical bar ± SEM (grey area). In barhistograms, the causes of mortality before the grey area are detailed incomparison to the controls (0). In black are the necessary euthanasia becauseof suffering in accordance with ethical rules (tumors over 25% body weight,more than 25% weight loss, hemorrhagic bleeding, etc.); and in hatched areas,spontaneous mortality."

