Complementation
Complementation tests if two different mutations that result in observable phenotypes are alleles of the same gene (allelic) or are mutations of different genes (non-allelic). If you have generated a range of mutants phenotypes for a trait it allows these mutations to be quickly and efficiently grouped by genes (rather than, for example, conducting fine scaled recombinant mapping). Complementation assumes simple dominance where the mutant phenotype is recessive to wild-type.
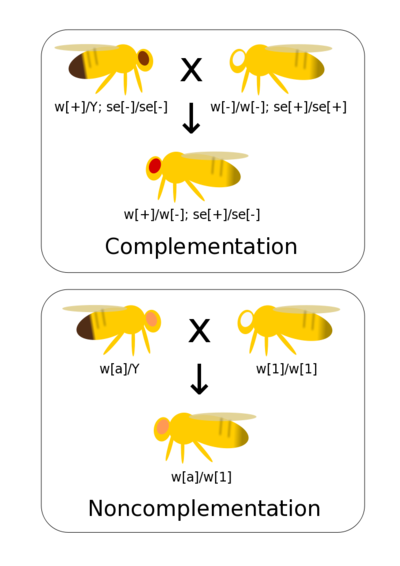
If there are mutations in the same gene then when homozygous lines are crossed together there is not a wild-type allele present in the heterozygote. Thus, the heterozygote has a mutant phenotype. This is non-complementation and indicates that the two mutants occur at the same gene (they are allelic to each other).
If there are mutations at two different genes then crossing true-breeding (homozygous) lines together generates double heterozygote offspring with a wild-type phenotype. This is complementation and indicates the two mutations occur at different genes.
Contents
Examples
Abstract example
Say we have three mutations, a[-], b[-], and c[-], that result in mutant wing phenotypes in Drosophila when homozygous. These mutant phenotypes are recessive to wild-type. First we cross a[-] and b[-] together.
a-/a-, c+/c+ x b-/b-, c+/c+
↓
a-/b-, c+/c+
a[-] and b[-] are two different alleles of the same gene and the wild-type phenotype is not restored (they failed to complement). We can rename these as the a[1] and a[2] alleles.
Now we cross a[1] and c[-] together.
a[1]/a[1], c+/c+ x a+/a+, c-/c-
↓
a[1]/a+, c+/c-
This double heterozygote has a wild-type phenotype because the phenotype corresponding to a[1] and the phenotype corresponding to c- are both recessive to wild-type. We can infer that these are alleles of two different genes because they complemented each other (restored a wild-type phenotype). We rename c- the c[1] allele now that we know it is an allele of a different gene.
Examples
Classical genetic
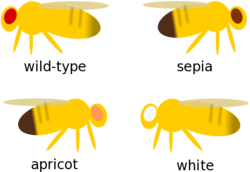
You have a collection of eye color phenotypes that vary from wild-type red. You want to see if these are due to alleles of the same gene or of different genes. All of the mutant phenotypes are recessive to wild-type.
First you cross sepia and white together. The offspring are wild-type. You can infer that the offspring are double heterozygotes and that sepia and white are different genes.
Next you cross apricot and white together. The offspring are apricot, not wild-type. You infer that apricot is an allele of white.
Hereditary deafness
Deaf couples form more often than expected by random chance. This is an example of positive assortative mating in humans (and it has been suggested that this helps promote the transmission of sign languages, Aoki and Feldman 1991). There is also an ethical dilemma associated with this; some deaf parents choose to have children that are deaf with PGD (preimplantation genetic diagnosis) screening (Sanghavi 2006). However, heredity deafness follows a predominantly autosomal recessive inheritance pattern and there is a great deal of genetic heterogeneity (many different genes are often responsible, Christina M. Sloan-Heggen et al. 2016). Therefore, the offspring of deaf couples are often not deaf because of complementation.
For a rough illustration the genes most often associated (a frequency of >1% in the total sample) with autosomal recessive deafness in Christina M. Sloan-Heggen et al. 2016 are listed in the table below (accounting for 93% of cases).
| Gene | Frequency | Frequency2 |
|---|---|---|
| GJB2 | 0.253 | 0.0640 |
| STRC | 0.191 | 0.0365 |
| SLC26A4 | 0.078 | 0.00608 |
| MYO15A | 0.056 | 0.00314 |
| MYO7A | 0.051 | 0.00260 |
| USH2A | 0.051 | 0.00260 |
| CDH23 | 0.048 | 0.00230 |
| ADCRV1 | 0.032 | 0.00102 |
| PCDH15 | 0.024 | 0.000576 |
| OTOF | 0.024 | 0.000576 |
| TMPRSS3 | 0.024 | 0.000576 |
| TECTA | 0.022 | 0.000484 |
| TMC1 | 0.022 | 0.000484 |
| LOXHD1 | 0.022 | 0.000484 |
| OTOA | 0.022 | 0.000484 |
| PTPRQ | 0.011 | 0.000121 |
| Sum | 0.931 | 0.122 |
Following the simplest assumptions (ignoring, for example, differences in allele frequencies between populations and assuming these frequencies represent homozygous genotypes for a causative allele) the probability that autosomal recessive deaf parents will both have the same gene responsible is the square of the genotype frequency (this uses the independence/multiplication rule of probability). One minus the sum of these squares is a rough approximation of the rate of complementation (non-deaf children due to autosomal recessive hereditary deafness), which works out to greater than 85% (1 - 0.122 = 0.878).
The genes most commonly involved with hereditary deafness are GJB2 and STRC. GJB2 is found on chromosome 13 and is expressed in the cochlea of the inner ear where it produces connexin proteins that form channels between cells (gap junctions) and likely has a role in maintaining potassium ion levels between cells (presumably used to convert sound to a nerve impulse). STRC is located on chromosome 15 and produces stereocilin, a protein found on the hair cells of the inner ear connecting them to the tectorial membrane where they help to detect sound vibrations of certain freqeuncies.
According to the frequencies in the table above almost 10% of hereditary deaf couple will have one parent with GJB2-/- and the other parent STRC-/-(2 * 0.253 * 0.191 = 0.0966, this is multiplied by two because there are two ways to get this cross, the father with GJB2-/- and mother with STRC-/- or vice versa).
GJB2-/GJB2-, STRC+/STRC+ x GJB2+/GJB2+, STRC-/STRC-
↓
GJB2+/GJB2-, STRC+/STRC-
This results in a child that is a double heterozygote at GJB2 and STRC. The child has one fully functional allele of both GJB2 and STRC so stereocilin is produced to mechanically detect sound and the proper potassium ion levels are maintained to convert this into a nerve impulse.
Deletion mapping
Lines with heterozygous deletions with well defined boundaries exist for some model organisms such as the Drosophila DrosDel collection (using the FLP recombinase system with FRT sites inserted across the genome by P-elements). If the deletion overlaps a mutation a mutant phenotype results from the hemizygote—the deletion and mutation are in non-complementation.
Larger deletions can be used to quickly find a region of the chromosome that the disrupted gene is located within. Then finer scale deletions within the larger region can be used to more precisely map the mutation.
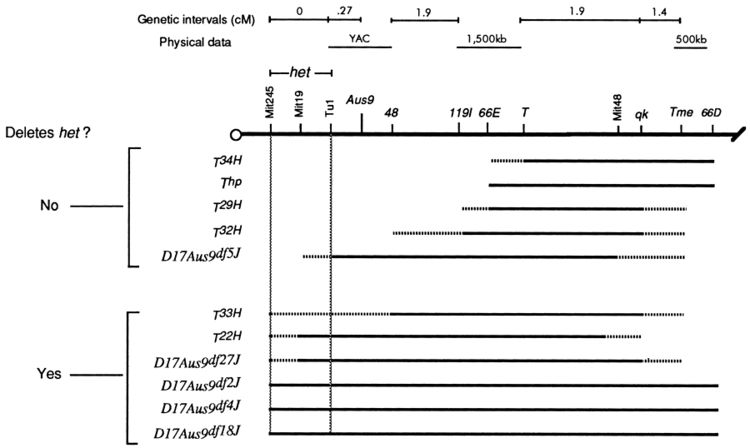
Bergstrom et al. 1998 studied the Head Tilt (het) phenotype in mice. These mice show abnormal movement responses and lack otoliths in the inner ear. The mutation had been mapped to chromosome 17. Bergstrom et al. (1998) crossed homozygous het-/- mice to mice with a range of spontaneous and radiation induced deletions on chromosome 17. Deletions that spanned a small region near the centromere failed to complement het. The authors inferred that the gene corresponding to het when disrupted is found in this area.
(Note, deletion mapping can also be done directly on haploid or hemizygous chromosomes such as the Y-chromosome or hoomozygous deficiency lines without complementation—the deleted region directly results in the phenotype. Also, a form of positional cloning surveys for complementation between artificial chromosomal segments and the corresponding region of the endogenous chromosome carrying a mutation.)
Complementation tables
Pairwise crosses can be made and organized into a complementation table where a + indicates complementation (a wild-type phenotype in the offspring) and a - indicates non-complementation (a mutant phenotype).
| mutant 1 | mutant 2 | mutant 3 | mutant 4 | mutant 5 | mutant 6 | |
|---|---|---|---|---|---|---|
| mutant 1 | - | + | - | + | + | - |
| mutant 2 | + | - | + | - | + | + |
| mutant 3 | - | + | - | + | + | - |
| mutant 4 | + | - | + | - | + | + |
| mutant 5 | + | + | + | + | - | + |
| mutant 6 | - | + | - | + | + | - |
In the example table above mutants 1, 3, and 6 form a complementation group (fail to complement each other). Mutants 2 and 4 also form a complementation group. The mutants in this table represent allele at three different genes.
- Gene 1 has mutant alleles 1, 3, and 6.
- Gene 2 has mutant alleles 2 and 4.
- Gene 3 has mutant allele 5.
The table can be rearranged to make the complementation groups easier to visualize.
| mutant 1 | mutant 3 | mutant 6 | mutant 2 | mutant 4 | mutant 5 | |
|---|---|---|---|---|---|---|
| mutant 1 | - | - | - | + | + | + |
| mutant 3 | - | - | - | + | + | + |
| mutant 6 | - | - | - | + | + | + |
| mutant 2 | + | + | + | - | - | + |
| mutant 4 | + | + | + | - | - | + |
| mutant 5 | + | + | + | + | + | - |
Heterokaryons
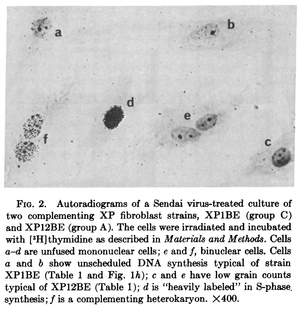
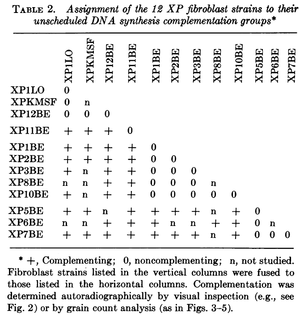
The nuclei of two different cells can be artificially combined into a single multinucleate cell (using polyethylene glycol, Sendai virus, or other methods) known as a heterokaryon (there are also examples of natural heterokayons). This allows the nuclei to share gene products within the cell and thus allows complementation testing between variants present in the parent cells (e.g., Gravel et al. 1979).
This was done with cells from patients that had Xeroderma Pigmentosum, an autosomal recessive disorder where cells cannot repair UV damage. In one study four complementation groups were found with heterokaryones that were deficient in DNA repair after exposure to UV light Kraemer et al. 1975.
Questions
Unusual heterokaryon complementation patterns
Exceptions
Exceptions (except for dominant mutant phenotypes) are rare but they can give insights into gene products with functions that are closely associated.
Dominance
Cases where the mutant phenotype is incompletely dominant or dominant to wild-type, such as gain-of-function hypermorphs violate the assumptions used in complementation testing. This can be seen above in the chicken example where Bl and I did not complement with other genes in double heterozygotes.
Intragenic complementation
The complementation table below shows an inconsistency. Mutants 1 and 3 are both allelic to 6; yet they complement each other.
| mutant 1 | mutant 3 | mutant 6 | mutant 2 | mutant 4 | mutant 5 | |
|---|---|---|---|---|---|---|
| mutant 1 | - | + | - | + | + | + |
| mutant 3 | + | - | - | + | + | + |
| mutant 6 | - | - | - | + | + | + |
| mutant 2 | + | + | + | - | - | + |
| mutant 4 | + | + | + | - | - | + |
| mutant 5 | + | + | + | + | + | - |
An example to potentially explain this: If mutations that disrupt tissue specific alternative promoters or alternative splicing variants are responsible for altered phenotypes then having two mutant alleles that are disrupted in different ways can restore a wild-type phenotype (because at least one allele will function correctly in each tissue or stage of development). Similarly, mutations that affect different active parts of a protein may also be able to compensate for each other.
Unlinked noncomplementation
Occasionally different genes can fail to complement, resulting in an inconsistent complementation table pattern such as the result from the mutant 3 and mutant 4 double heterozygote indicated below.
| mutant 1 | mutant 3 | mutant 6 | mutant 2 | mutant 4 | mutant 5 | |
|---|---|---|---|---|---|---|
| mutant 1 | - | - | - | + | + | + |
| mutant 3 | - | - | - | + | - | + |
| mutant 6 | - | - | - | + | + | + |
| mutant 2 | + | + | + | - | - | + |
| mutant 4 | + | - | + | - | - | + |
| mutant 5 | + | + | + | + | + | - |
If gene products from two different genes directly interact, such as subunits in a complex, the presence of additional disruptive subunits from a double heterozygote can result in a mutant phenotype that would otherwise be below the phenotype threshold for either single heterozygote.
Also, if two protein functions are closely associated, such as steps in the same biochemical pathway, they can fail to complement in a double heterozygote; again slightly reducing multiple steps along a pathway in a double heterozygote may push the result over the threshold for an observable phenotype.
This is also known as second-site noncomplementation or nonallelic noncomplementation and one form of this can be termed combined haplo-insufficiency
History
The complementation test was originally referred to as the cis-trans test where phenotypes were compared when two mutations were either in cis on the same chromosome copy (this requires fine scale recombination for mutations in the same gene and is not typically done today) or in trans on the two homologous chromosomes. The origin of this test has been attributed to Ed Lewis and Seymour Benzer (see Hawley and Gilliland 2006 for a discussion).
Links
http://www.wormbook.org/chapters/www_complementation/complementation.html
http://www.genetics.org/content/174/1/5
