Category Archives: Uncategorized

Cloning: Results May Vary

This post is two weeks out of order but Brian Deis had a surprise for us on Halloween.

BrianClone

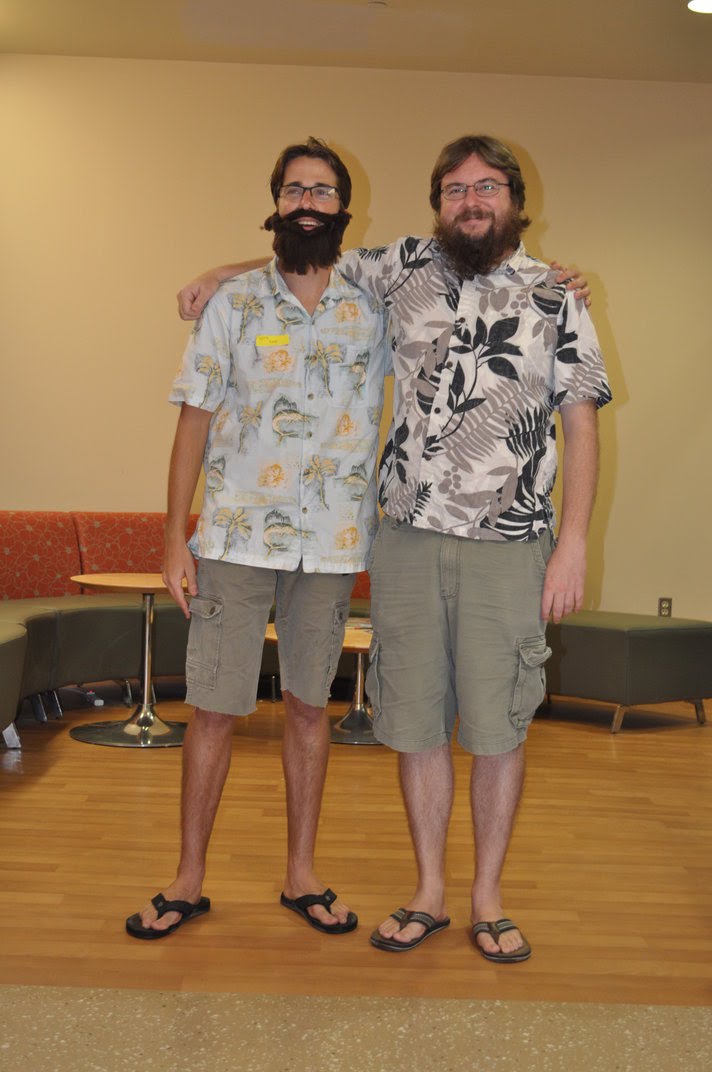
Brian came as my twin "Loyd Reed" on his name tag.  He had a fake beard, glasses, Hawaiian shirt, shorts, belt and flip-flops ("slippers" here in Hawai'i) to match and even tried to part his hair in a similar way.  He was in one of my classes later in the day so I sat in the audience at first and he was up "on the stage" when people walked in.  He created a lot of smiles around the department.

I have to apologize for stealing the photo from one of Jolene's blog posts:

https://sites.google.com/site/jolenesutton/current-research/Research-Blog/itisntallworkandnoplayinthebiologydepartment

The irony to this is that, unkown to Brian, I am named after my grandfather Floyd that in fact had an identical twin named Lloyd.

Our Sea Urchin Work on TV

Our own Aki Laruson and Caitlyn Genovese from the Moran lab were interviewed yesterday by Jay Fidell in a "Research at UH Manoa" segment on "ThinkTech Hawai'i".  Here is the YouTube link

and the descriptive blurb:

Research at UH Manoa
Understanding Urchins
Research at UH Manoa, with graduate students Aki Laruson and Caitlyn Genovese

Sea urchins, called wana in Hawaiian, are common on the rocks and reefs surrounding our islands. UH Manoa graduate student Aki Laruson is working to identify patterns of genomic divergence in so-called "collector" urchins, Tripneustes sp. These are the urchins that have been put to task to help control invasive seaweed growing in Kaneohe Bay. Caitlyn Genovese is studying growth energetics in marine invertebrate larvae including the local urchin population. Together they are using a variety of techniques ranging from phylogenetics to ecology to population genetics to bring new light to the evolutionary relationships of this pantropical species.
When
Mon Nov 10, 2014 1pm – 2pm Hawaii Time

To be honest, I was troubled by the hosts references to homeless children, "urchins," at the beginning of the interview, but Aki and Caitlyn both did a great job!

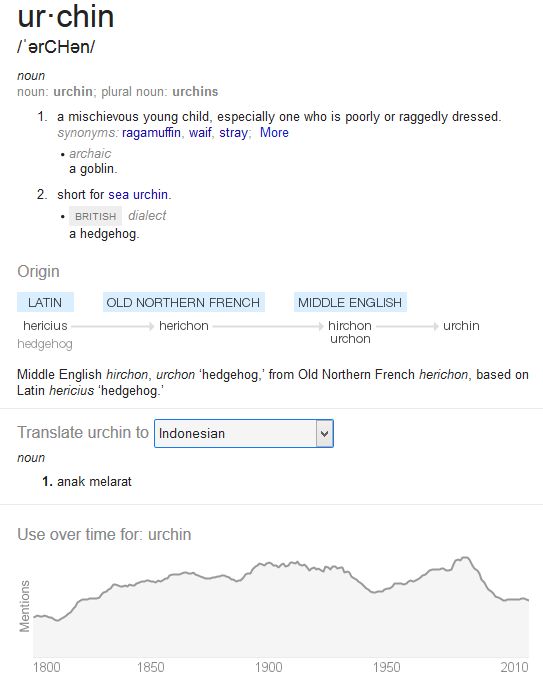
Some more info about urchin etymology from Google:

urchin

Evolution and the Monkey Typewriter Problem

I have been teaching myself R lately and had an idea for a simulation the other night so I've been working on this...

Many of us are familiar with the idea that eventually a room full of monkeys with typewriters will type the complete works of Shakespeare (the so-called infinite monkey theorem).  This has been used as an argument to illustrate ideas of biological evolution.  However, it falls far short.  The infinite monkey theorem works well for the intuition of random mutations, but it does not illustrate the power of selection and recombination to enrich the frequency of closer matches to a given text in a population (for mutation then to act upon).

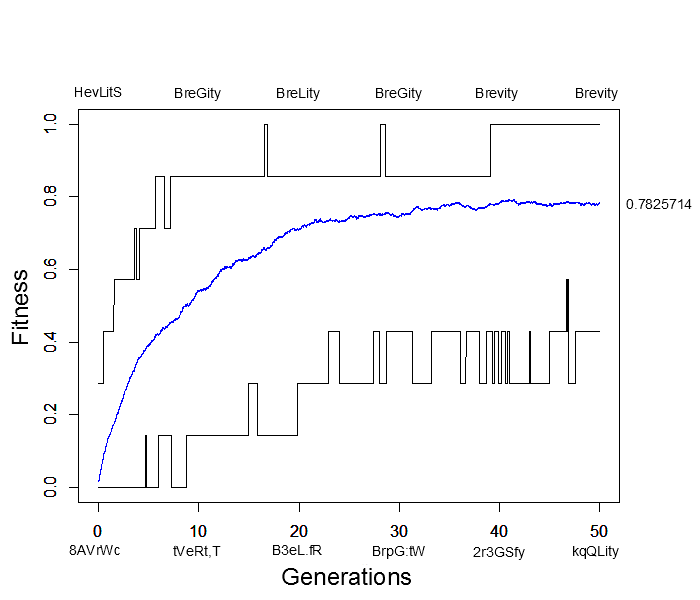
I wrote a script to try to illustrate this and evolved seven random letters to the word "Brevity."  This used random mutation, assigned relative fitness values to the sequences based on how many letters matched "Brevity," and recombined sequences randomly in the population.  Here is a plot of how the simulation preformed.  The average fitness in the population is shown by the blue line, the maximum fitness over all sequences is the upper line in the plot and the minimum fitness is the lower line.  Examples of the maximally and minimally fit sequences are given above and below the plot every ten generations.
n500mut50rec2genn50annotate

This simulation was based on 500 sequences (or the equivalent of 250 diploid individuals) with a per generation, per character mutation rate of 2% and a per generation, per sequence recombination rate of 50%.  In less than 40 generations the population contained perfectly matching individuals spelling out "Brevity" from a starting best match of "HevLitS" in the first generation.  However, the population appears to have reached an apparent fitness equilibrium of close to 80% and poorly matching (40% fitness) sequences such as "kqQLity" remain at generation 50.  This is much sorter than the complete works of Shakespeare; however, it is also clear that the target "Brevity" was arrived at much faster with selection in a population than by just random mutation.

In fact, the target sequence was arrived at a couple of times, even briefly before 20 generations, but then disappeared again before the longer term arrival at 40 generations.  This illustrates one result of population genetics, that even though a new mutation may be more fit than any other versions (alleles) in the population, it is actually more likely to be lost by genetic drift (evolutionary sampling error) in the following generations than to increase dramatically in frequency.

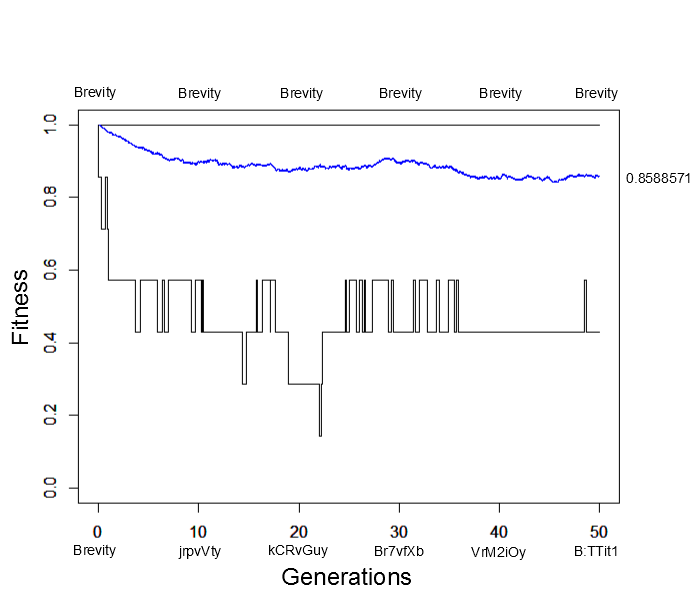
What would happen if the simulation were allowed to run for much longer, say 500, 5,000 or even five million generations?  Would the average fitness eventually reach 100% with the entire population made up of the target "Brevity" (with the occasional rare mutation of course)?  An easier way to answer this than running the simulation for a very long time is to start the population with all perfect matches and see how closely it remains at this peak starting point.  Here is the result (under the same parameter values as the simulation result above):
n500mut50rec2genn50topdownannotate

Immediately the average fitness drops dramatically with sequences like "jrpvVty" appearing by generation 10.  At generation 50 the population arrives at a fitness near 85% of the maximum possible with lower bound fitnesses of 40%.  This is not far away from the near 80% arrived at before (also with a lower bound of 40%).  This illustrates the concept of "mutational load" in a population---that the average fitness will be quite a bit less than the theoretical maximum at mutation-selection equilibrium.  It takes time for deleterious mutations to be purged by selection and the net effect is a sizable reduction in fitness, in the case an average reduction of 15% to 20% from the maximum possible.

I am planning to continue discussing this in a few more posts.  This simulation might be a good way to illuminate the effects of population size,  mutation rates, recombination rates, and genome size on the evolutionary trajectory of a population.

While making this post I also inadvertently learned about a similar simulation called the "weasel program" by Richard Dawkins.  However, there are some important differences in the algorithm.  I also plan on discussing some ways the process of selection can be simulated---I came across some alternatives to the way natural evolution is typically modeled that dramatically change the trajectory of average population fitness, including the framework used by Dawkins.

Here is the R source code if you want to play around with it yourself:

# output the results to a text file if printout set to 1, 0 otherwise
# you should change the path to match your directory structure
# (it runs faster without the text output)
printout=1
if(printout){
  sink("C:\\Users\\Floyd\\Desktop\\backup\\work\\typewriter\\monkey_type_7_out.txt", 
    append=TRUE, split=TRUE)
}

length=7 # sequence length
n=500 # number of seequences
mut=50 # inverse mutation rate, one out of #
rec=2 # inverse recombination rate, one out of #
step=n*50 # "generations" in a Moran model

# store the population of sequences
pop=matrix(0,nrow=n,ncol=length)
# a vector of sequences
fit=matrix(0,nrow=n,ncol=1)

# set initial random sequences
for(i in 1:n){
  x<- sample(c(0:9, letters, LETTERS," ",".",",",":"),
             length, replace=TRUE)
  pop[i, ]=x
}

# keep track of fitnesses and generations during the run
runbestfit<-numeric() # best fitness
runavefit<-numeric() # average fitness
runleastfit<-numeric() # least fit
rungen<-numeric() # generations

target<-"Brevity" # target sequence

# divide into characters in a matrix for testing
targ<-strsplit(target, "")
t<-matrix(unlist(targ))

# if(1) sets population to all match target for testing
# if(0) turns this off
if(0){
  for(j in 1:n){
    for(i in 1:length){
      pop[j,i]=t[i]
    }
  }
}

# loop through time steps
for(s in 1:step){

  rungen[s]=s/n # generations defined as n time steps

  badfit=length
  badfitind=1
  maxfit=0
  maxfitind=1
  matchsum=0
  # loop through each position and add up if a match exists
  for(j in 1:n){
    match=0
    for(i in 1:length){
      if(t[i]==pop[j,i]){match=match+1}
    }
    matchsum=matchsum+match
    if(match>maxfit){
      maxfit=match
      maxfitind=j
    }
    if(match<badfit){
      badfit=match
      badfitind=j
    }
  }
  bestexample<-paste(pop[maxfitind,], collapse="")
  worstexample<-paste(pop[badfitind,], collapse="")
  runavefit[s]=matchsum/(n*length)

  # report current status
  if(printout){
    print(paste(s/n, "best ", bestexample))
    print(paste(s/n, "worst", worstexample))
  }

  #pick random individual to copy from weighted by relative fitness
  randfitpoint=sample(matchsum,1)
  repind=1
  matchsum=0
  for(j in 1:n){
    match=0
    for(i in 1:length){
      if(t[i]==pop[j,i]){match=match+1}
    }
    matchsum=matchsum+match
    if(matchsum>=randfitpoint){
      repind=j
      break
    }
  }

  # pick random individual to be replaced
  pick=sample(n,1)
  for(i in 1:length){
    pop[pick,i]=pop[repind,i] # best way to represent natural population (?)
  }

  # add mutations to the replicating sequence
  for(i in 1:length){
    m=sample(mut,1)
    if(m==1){
      x<- sample(c(0:9, letters, LETTERS," ",".",",",":"),
                   1, replace=TRUE)
      pop[pick,i]=x
    }
  }

  # add recombination with another sequence to the replicating sequence
    r=sample(rec,1)
    if(r==1){
      another=sample(n,1)
      location=sample(length,1)
      for(i in location:length){
        temp=pop[pick,i]
        pop[pick,i]=pop[another,i]
        pop[another,i]=temp
      }
    }

  # update best and least fit
  runbestfit[s]=maxfit/length
  runleastfit[s]=badfit/length

  # update plot of results
  # only every 50 time steps so it doesn't run too slowly
  if(s%%50==0){
    plot(rungen,runbestfit,type="l",xlab="generation",ylab="fitness",ylim=c(0,1))
    par(new=T)
    plot(rungen,runavefit,type="l",col='blue',xlab=" ",ylab=" ",ylim=c(0,1))
    par(new=T)
    plot(rungen,runleastfit,type="l",lwd=0.1,xlab=" ",ylab=" ",ylim=c(0,1))
  }

  # report current average fitness
  if(printout){print(runavefit[s])}
}
Manipulating mosquito eggs

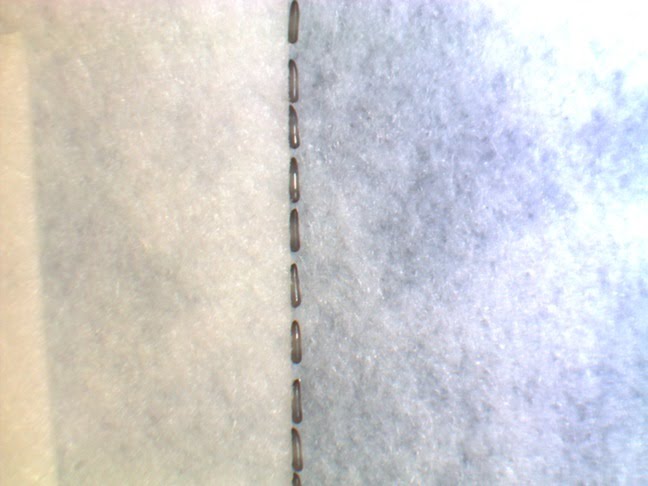
Now that we have stable caged populations of Culex mosquitoes and have worked out an egg laying on demand system the next incremental step is to separate the individual eggs from freshly laid egg rafts for microinjection.  (We have been advised that injecting them while together in an egg raft does not work well because of the pressure they put on each other during injections...)  Jolene worked out the timing to get fresh rafts, disassociated them, and lined them up on wet blotting paper (to keep them from drying out) on a microscope slide.

eggsforinjection-2014-10-22-09-21-42

To the immediate left of the eggs is an extra layer of paper to brace them for injection from the right.  They were very light in color at first but they got darker (and harden) quickly by the time the picture was taken.  She put this first set back into water to see if manipulating them affects survival.  (For more photos and news check out Jolene's research blog.)

In other related news, we have some of the plasmids we need cloned and I am working on cloning the last one this week (that contain the genetic modifications for injection), and my plasmid preps are working!  Fingers crossed, with any luck we can try serious microinjection to generate germ line Culex transformations three weeks from now during the next round of fresh egg production.  We are planning to generate the self docking system described (in Anopheles gambiae) by Meredith et al. 2013 in Culex.

We've been noticed!

It is no coincidence that my last post was in August.  Once classes started up I have had a very busy schedule and little time for anything else.

However, the thing that triggered this post is, I happened across an article that discussed one of our recent publications.  It is on the IGTRCN (insect genetic technology research coordination network) website in an article by Frank Crisione "Transgenic Underdominance: Pushing Transgenes into Populations".  It is good to know that people out there are reading our publications.

In a similar vein, a grad student here at UH in another lab (I am on his graduate committee) just published a nice article about his work for the general public, "Can a small fish answer the big question?" by Kirill Vinnikov.

Fluorescent Chromosomes

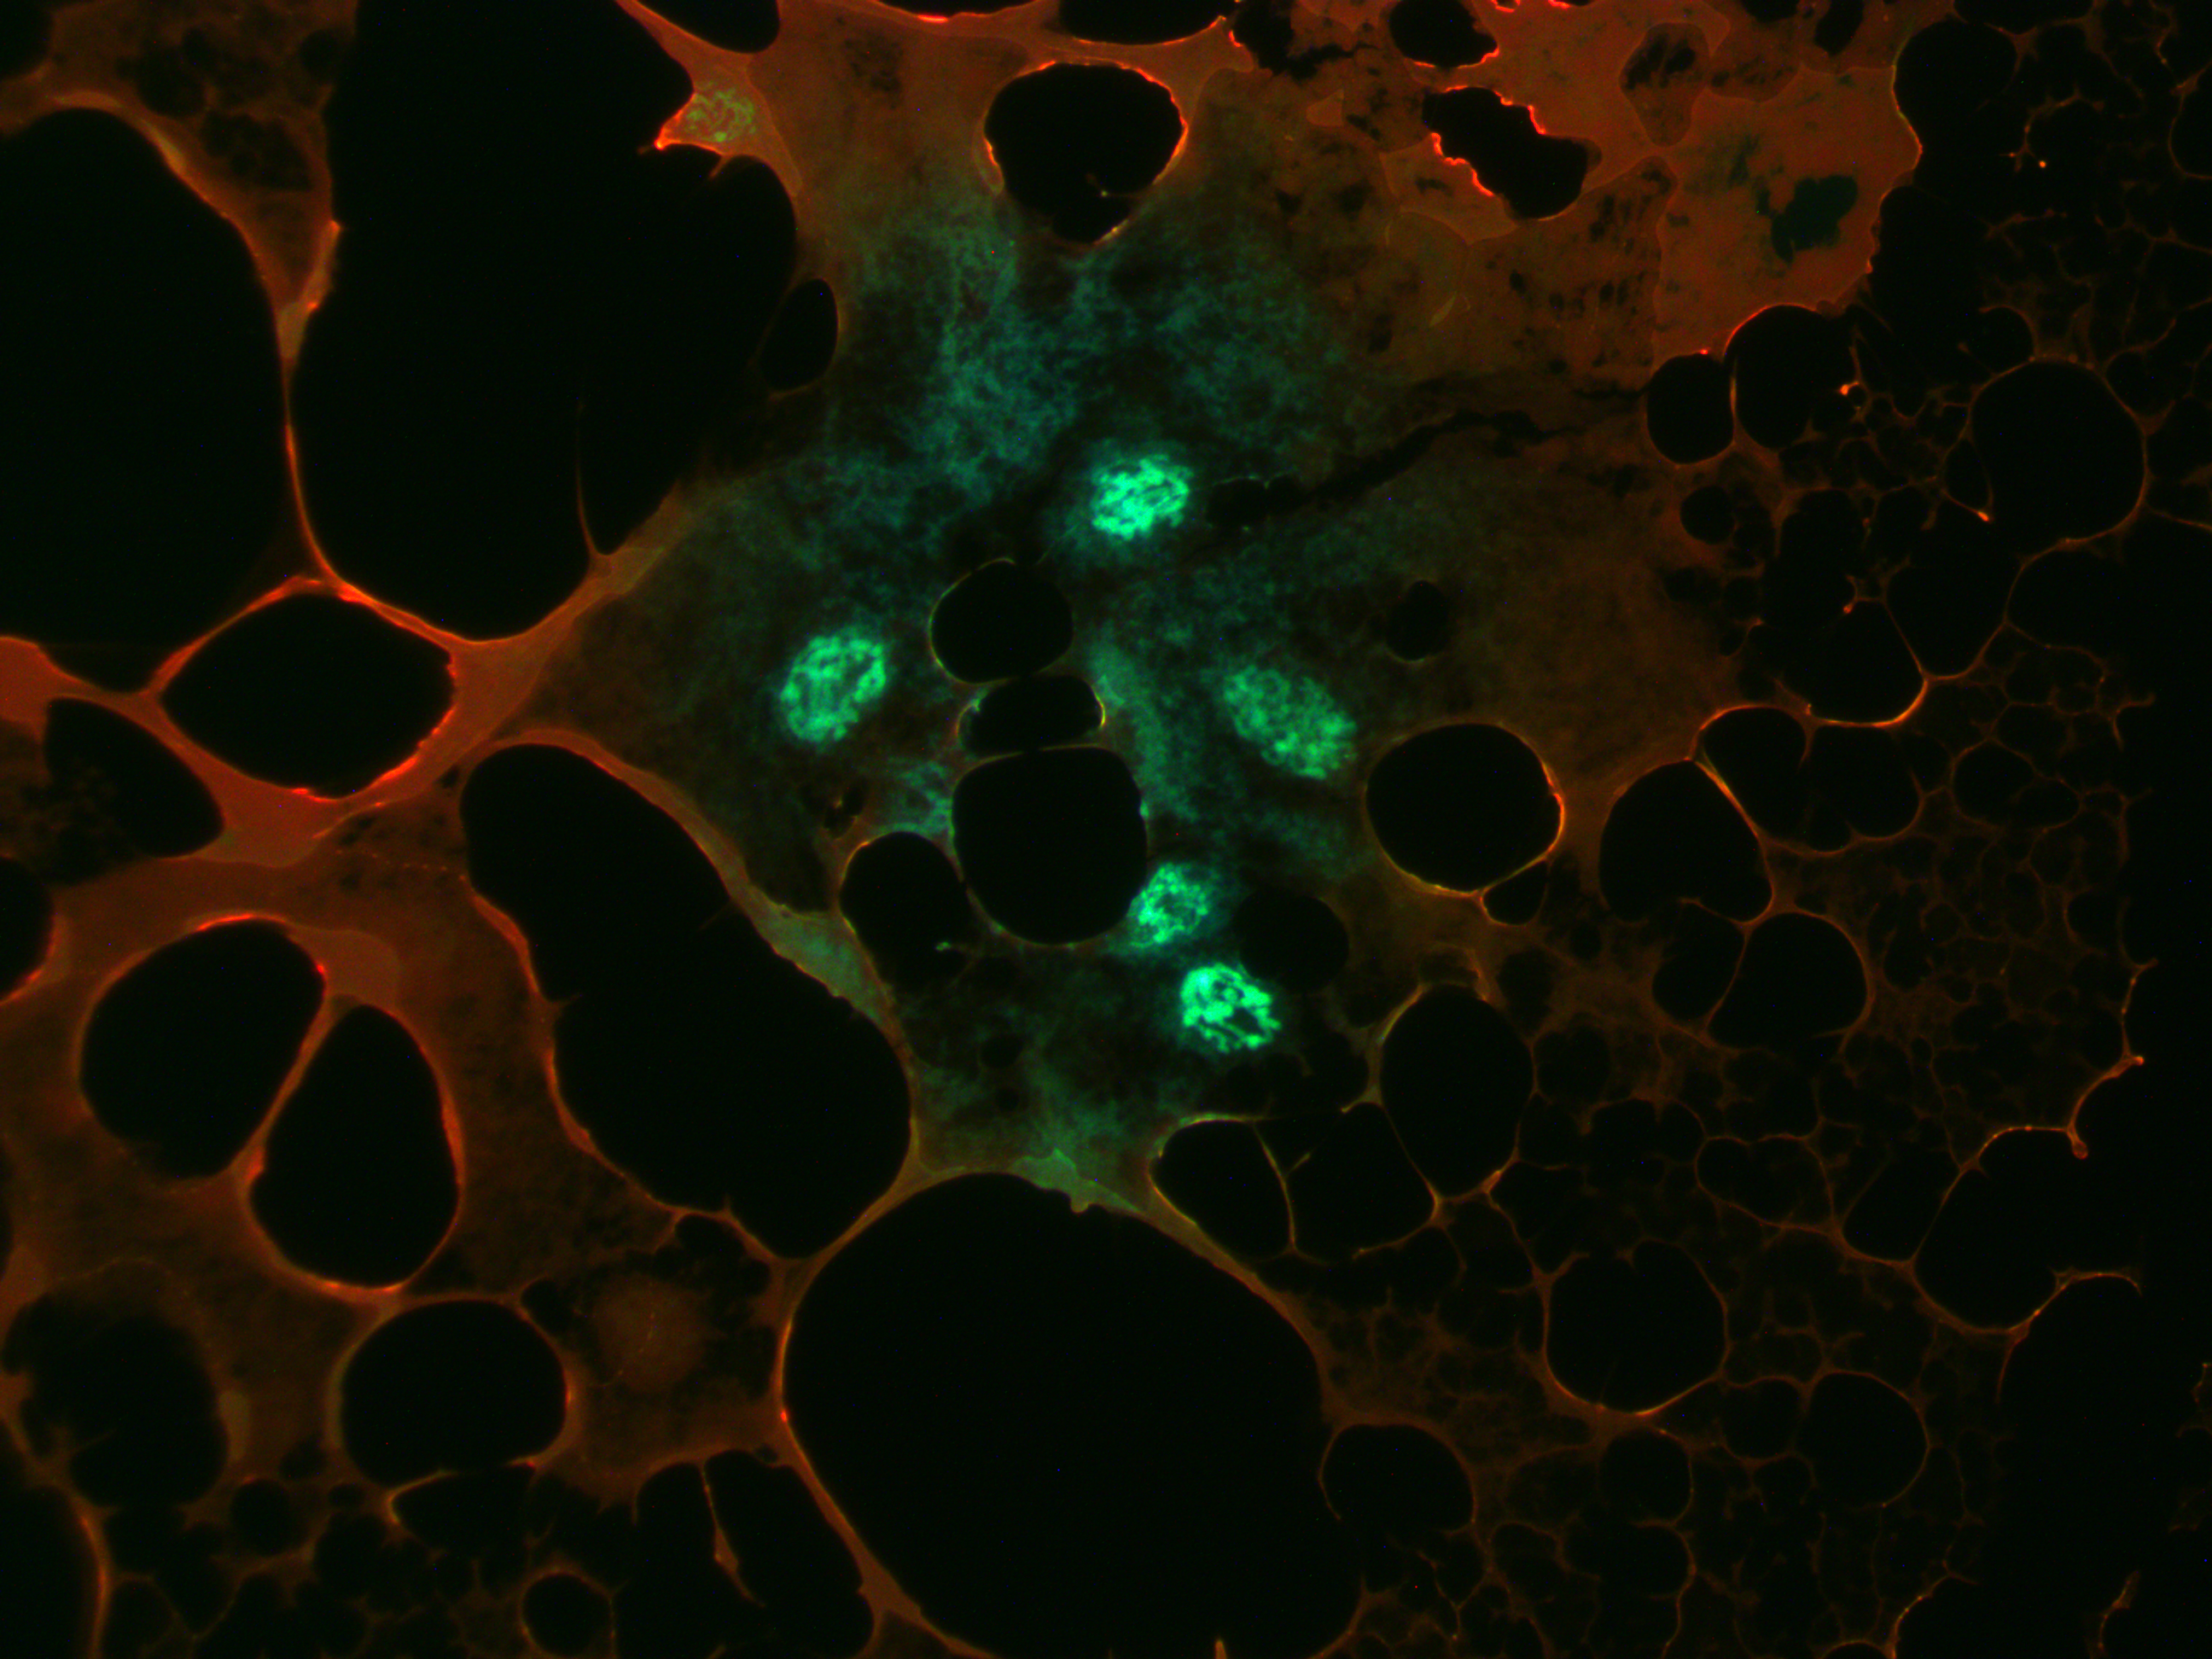
Kenton's project has progressed quickly.  We sorted out the issue with fluorescence (the light source was not aligned properly through the scope).

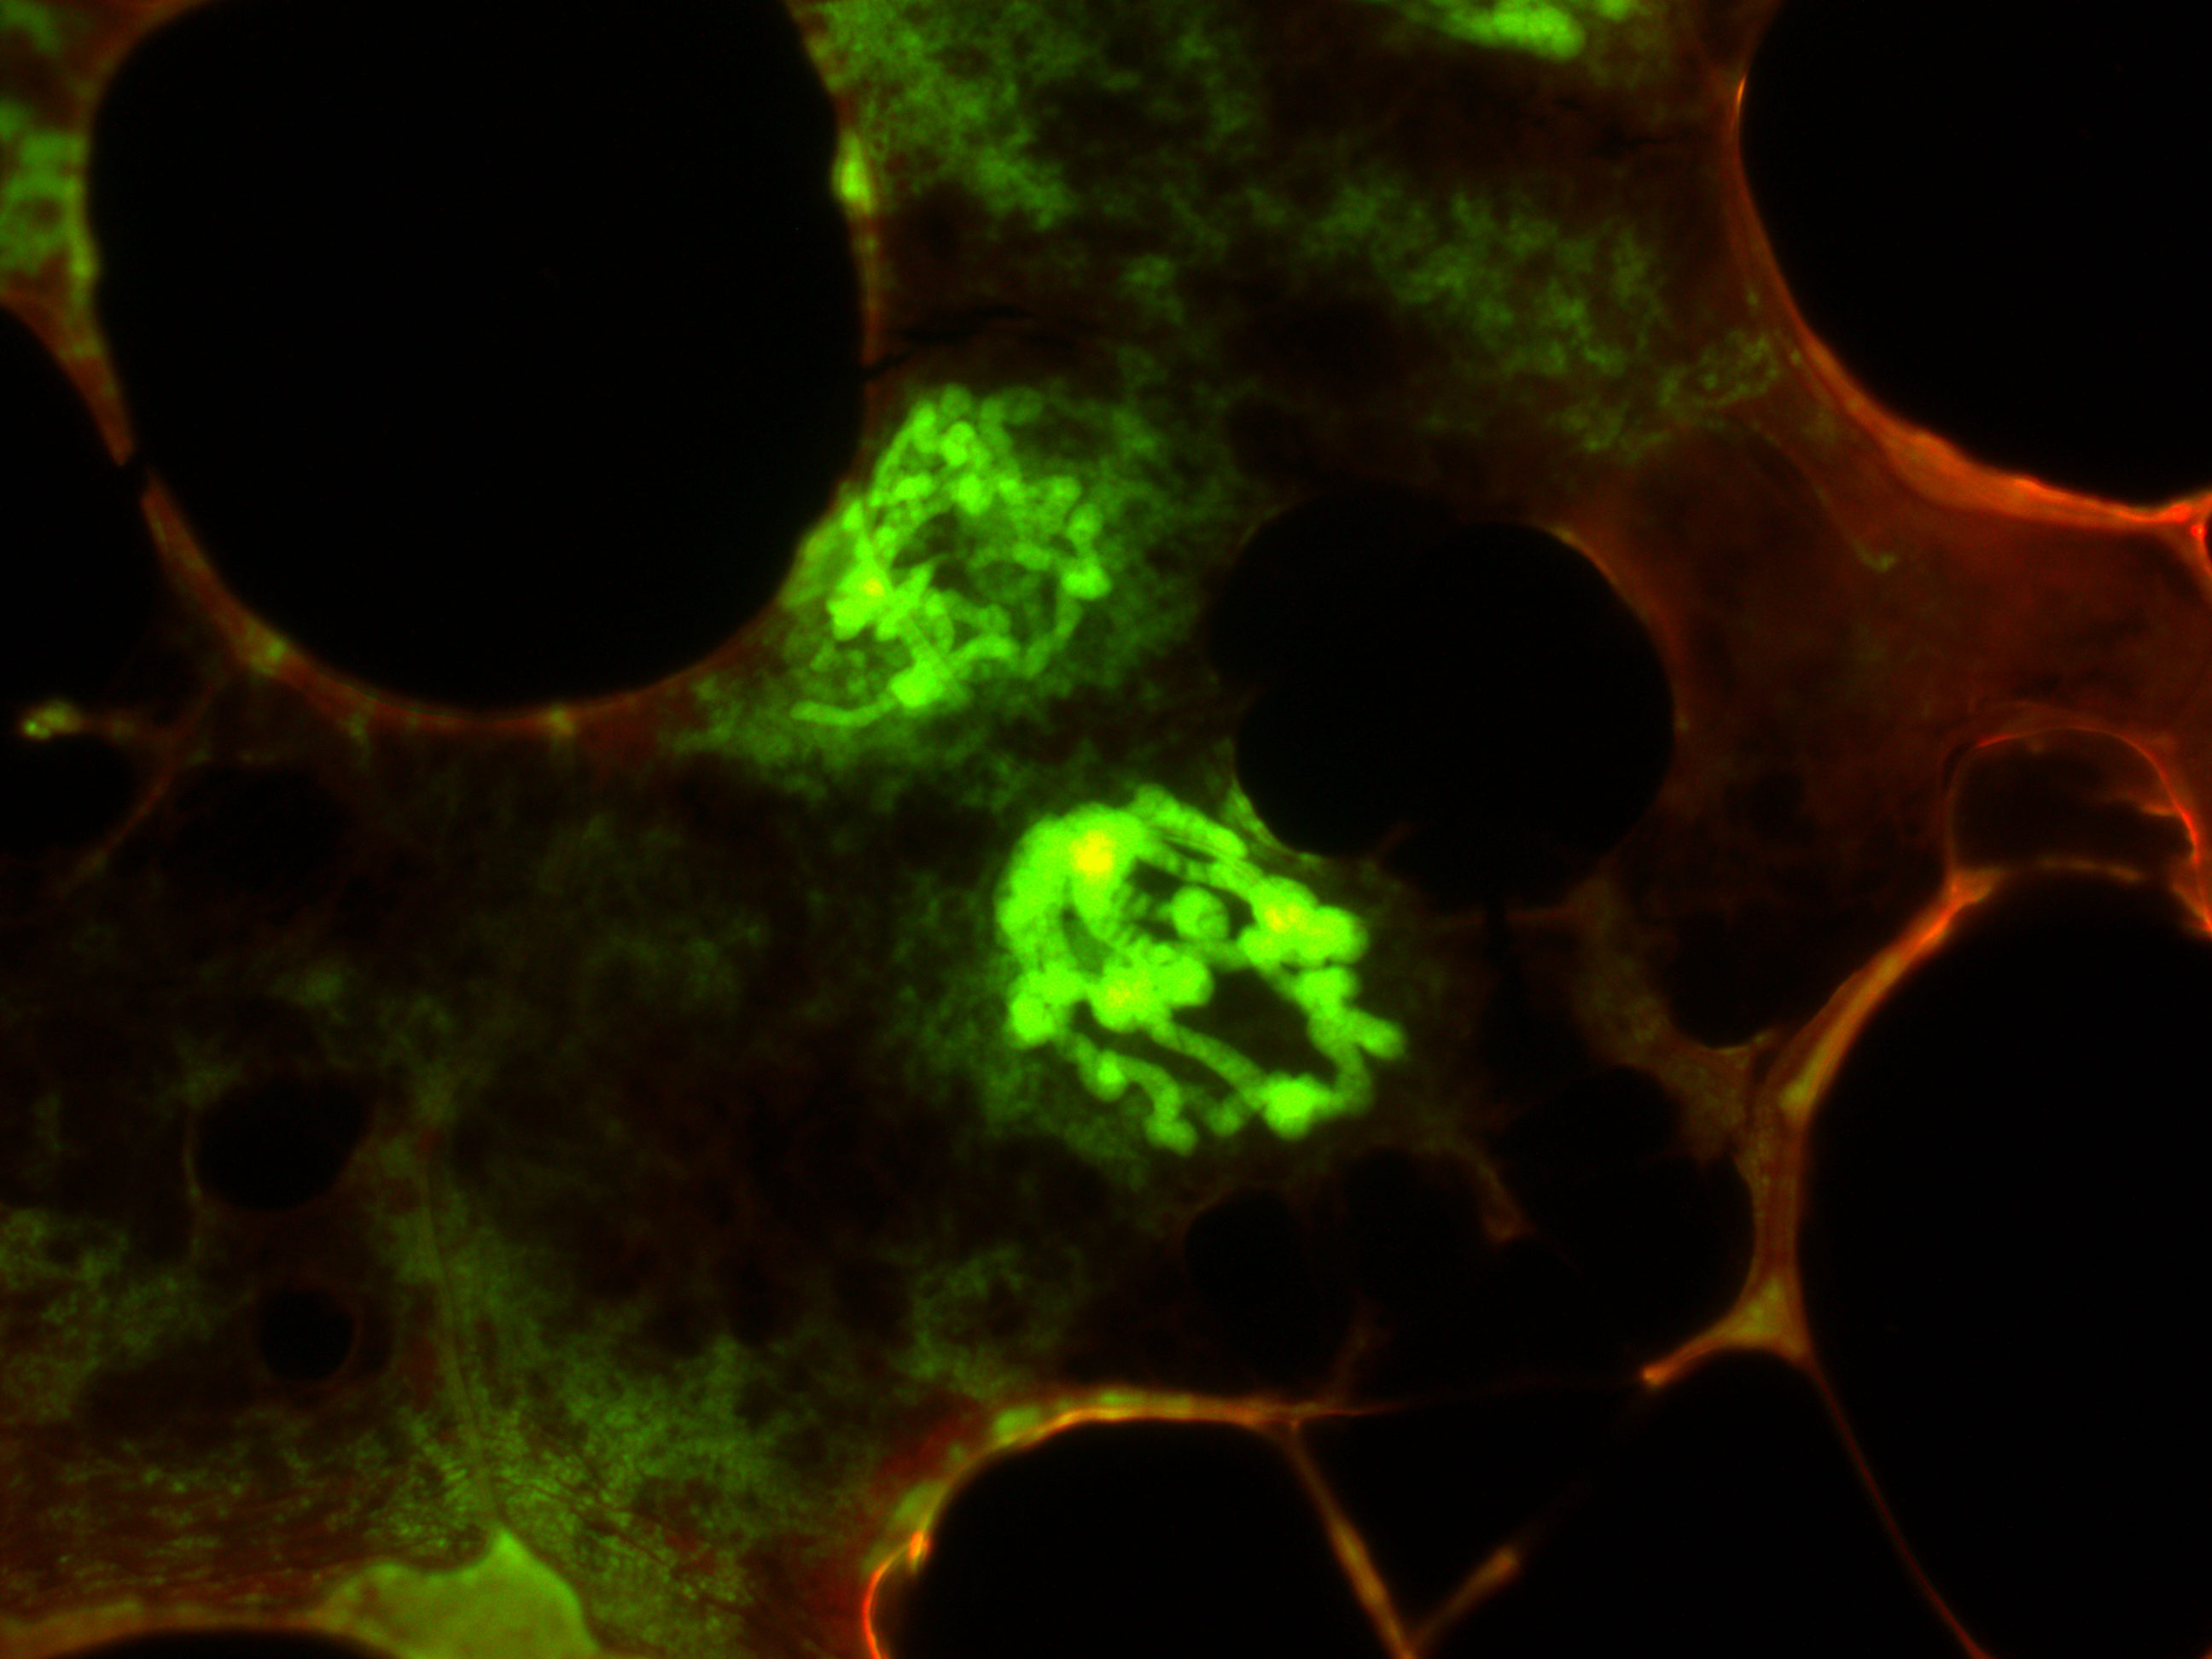
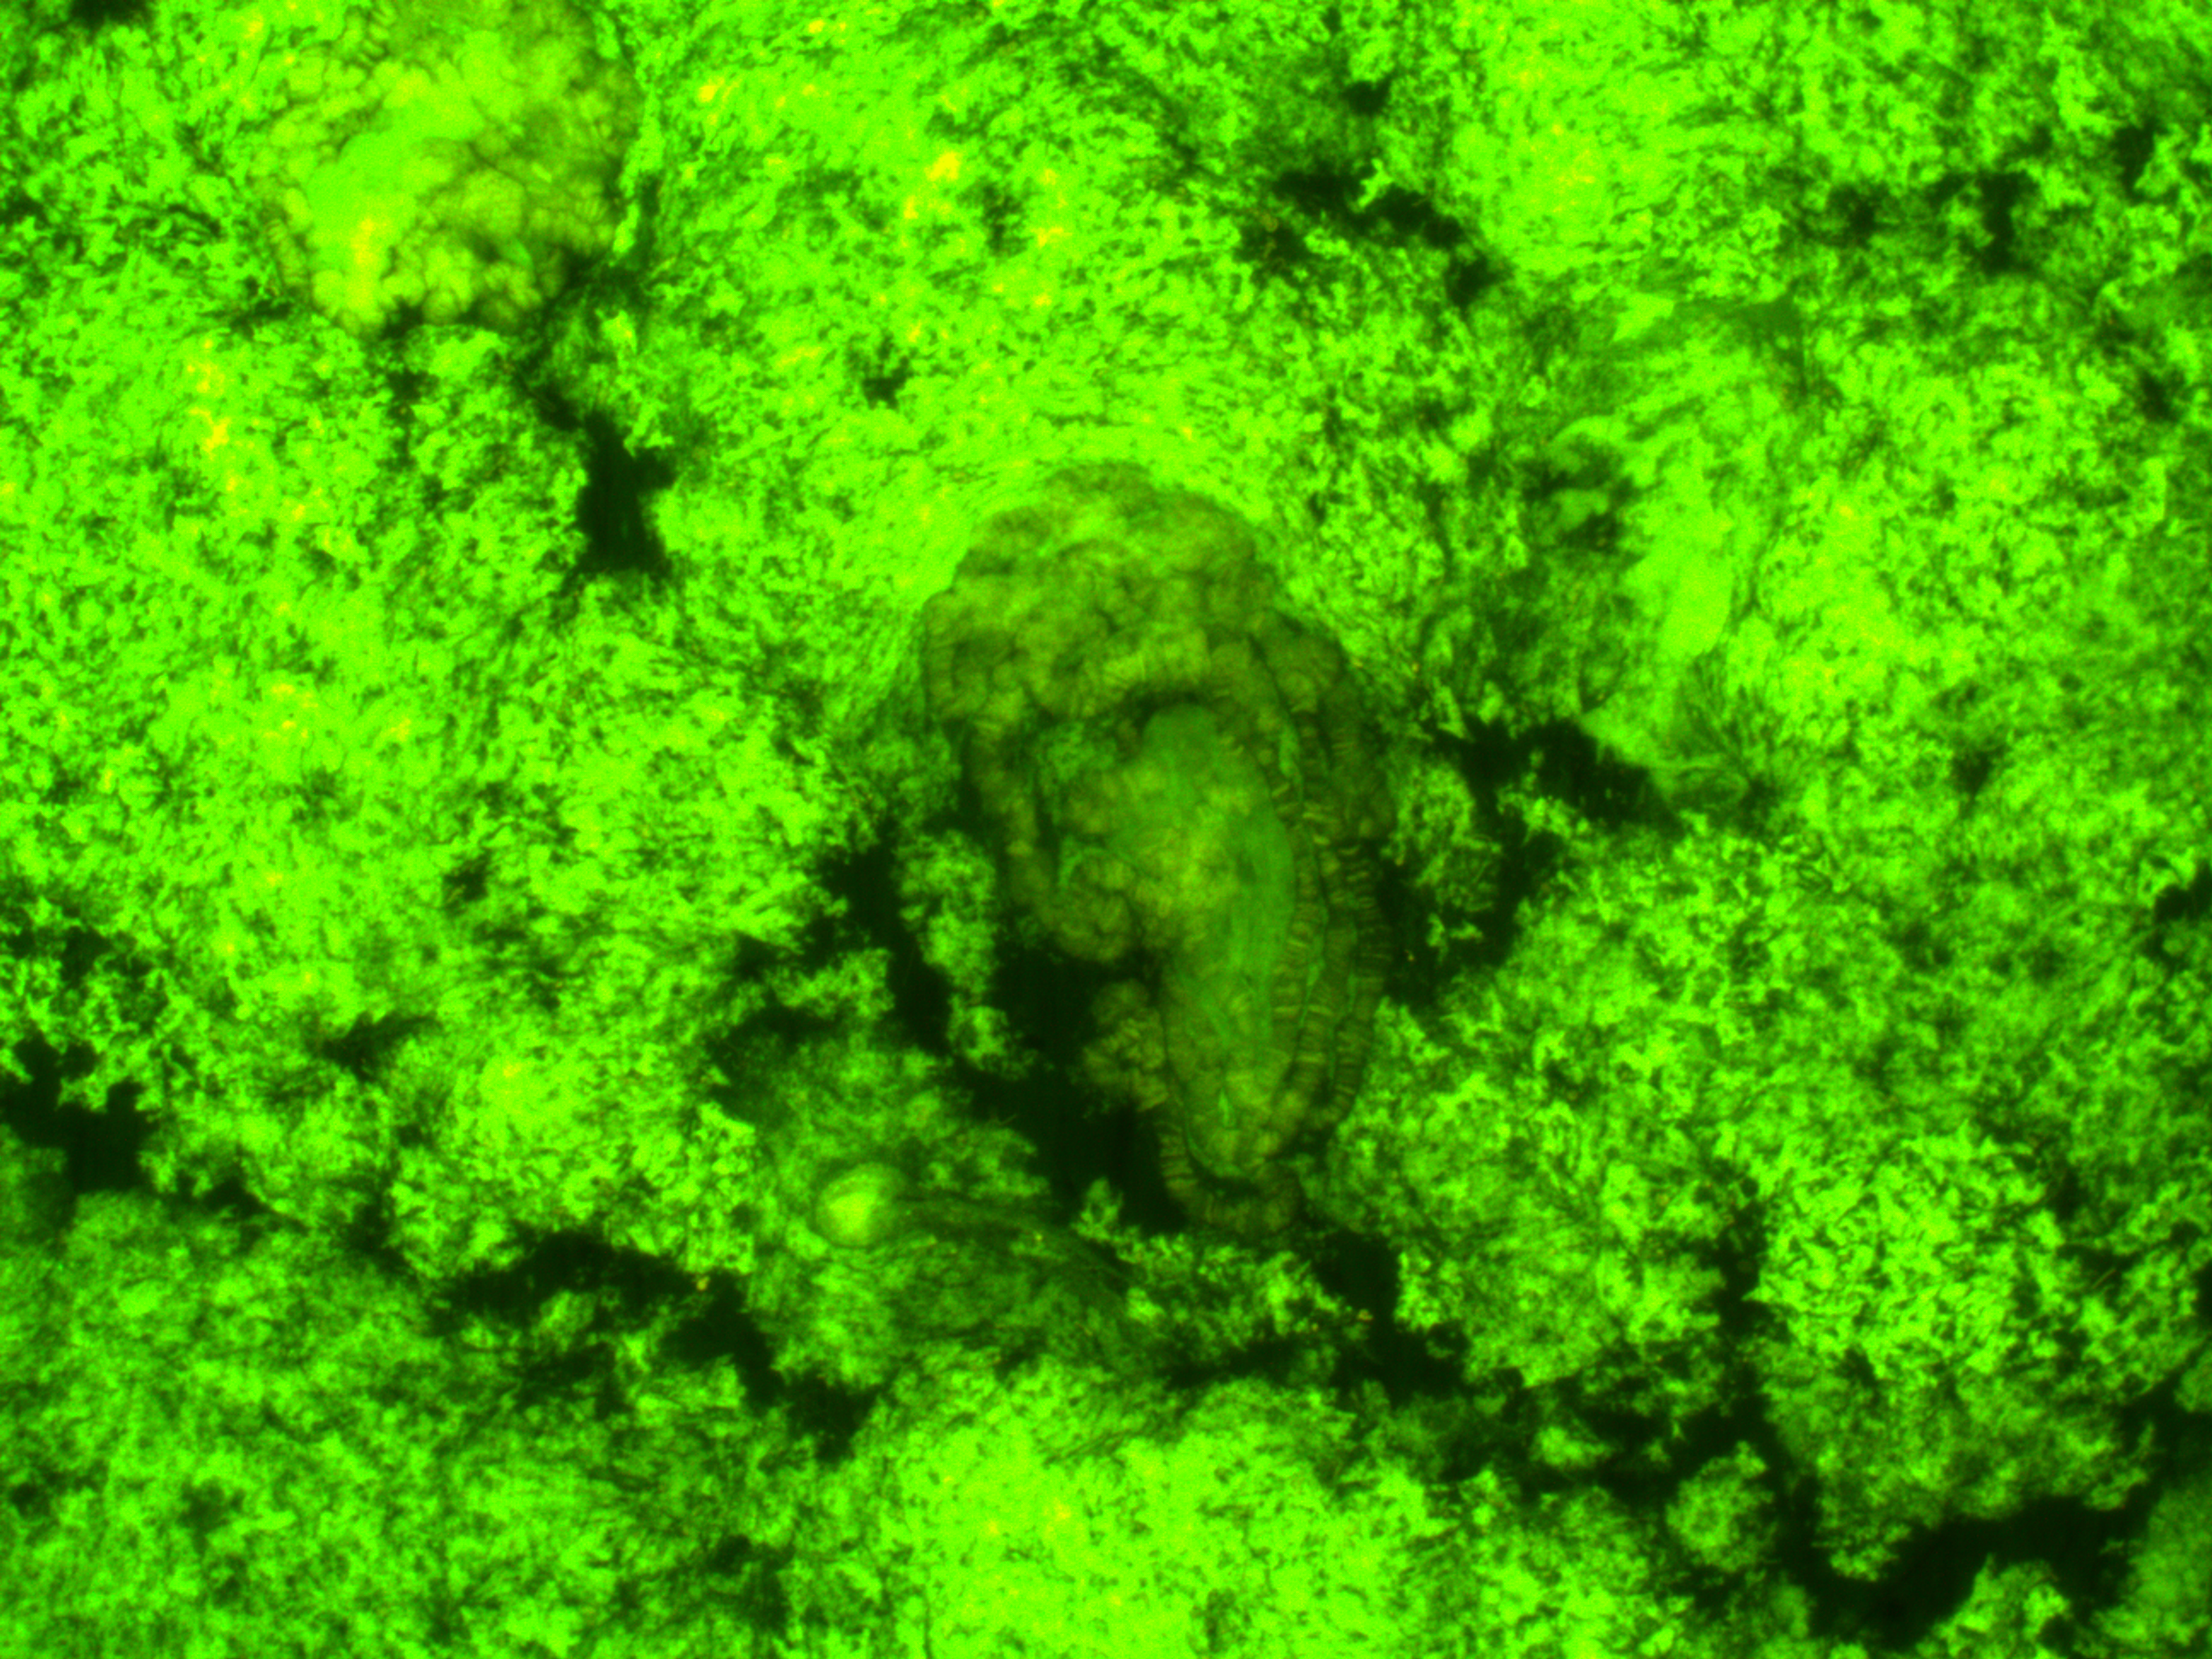
Here are some updated Drosophila chromosome images.  They have a stain that dyes the DNA and is causing it to glow so you can see the chromosomes.

mite-dmel-nyad-2014-07-30-16-07-02

mite-dmel-nyad-2014-07-30-16-11-03

You can see the banding in the close up above.

Take a look at this!

mite-dmel-nyad-2014-07-31-13-56-32

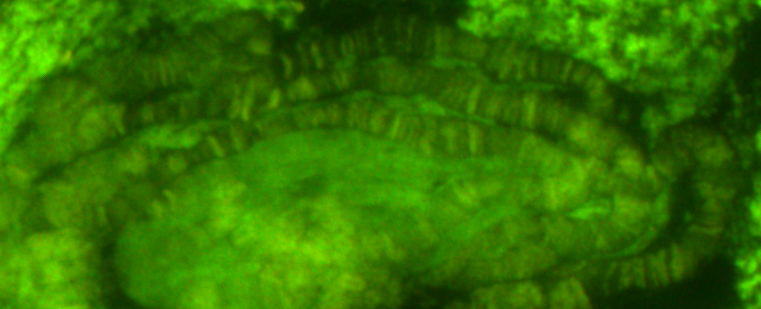
and the detail below.

mite-dmel-nyad-2014-07-31-13-56-32-detail

The spread isn't good but that's a clear banding pattern!

Now that this is working in Drosophila he has moved on to damselflies; his original interest.  He is trying different tissues at different life stages to see which ones give the best chromosomes.  The damsel fly chromosomes are smaller and there are many more of them so it is a bit challenging, but there are some more tricks up our sleeves to try out in order to increase resolution.  Kenton already has some promising images but I do not want to post them here yet because they are new and potentially publishable results.  However, expect an update on this topic in the future.

35 Egg Rafts!

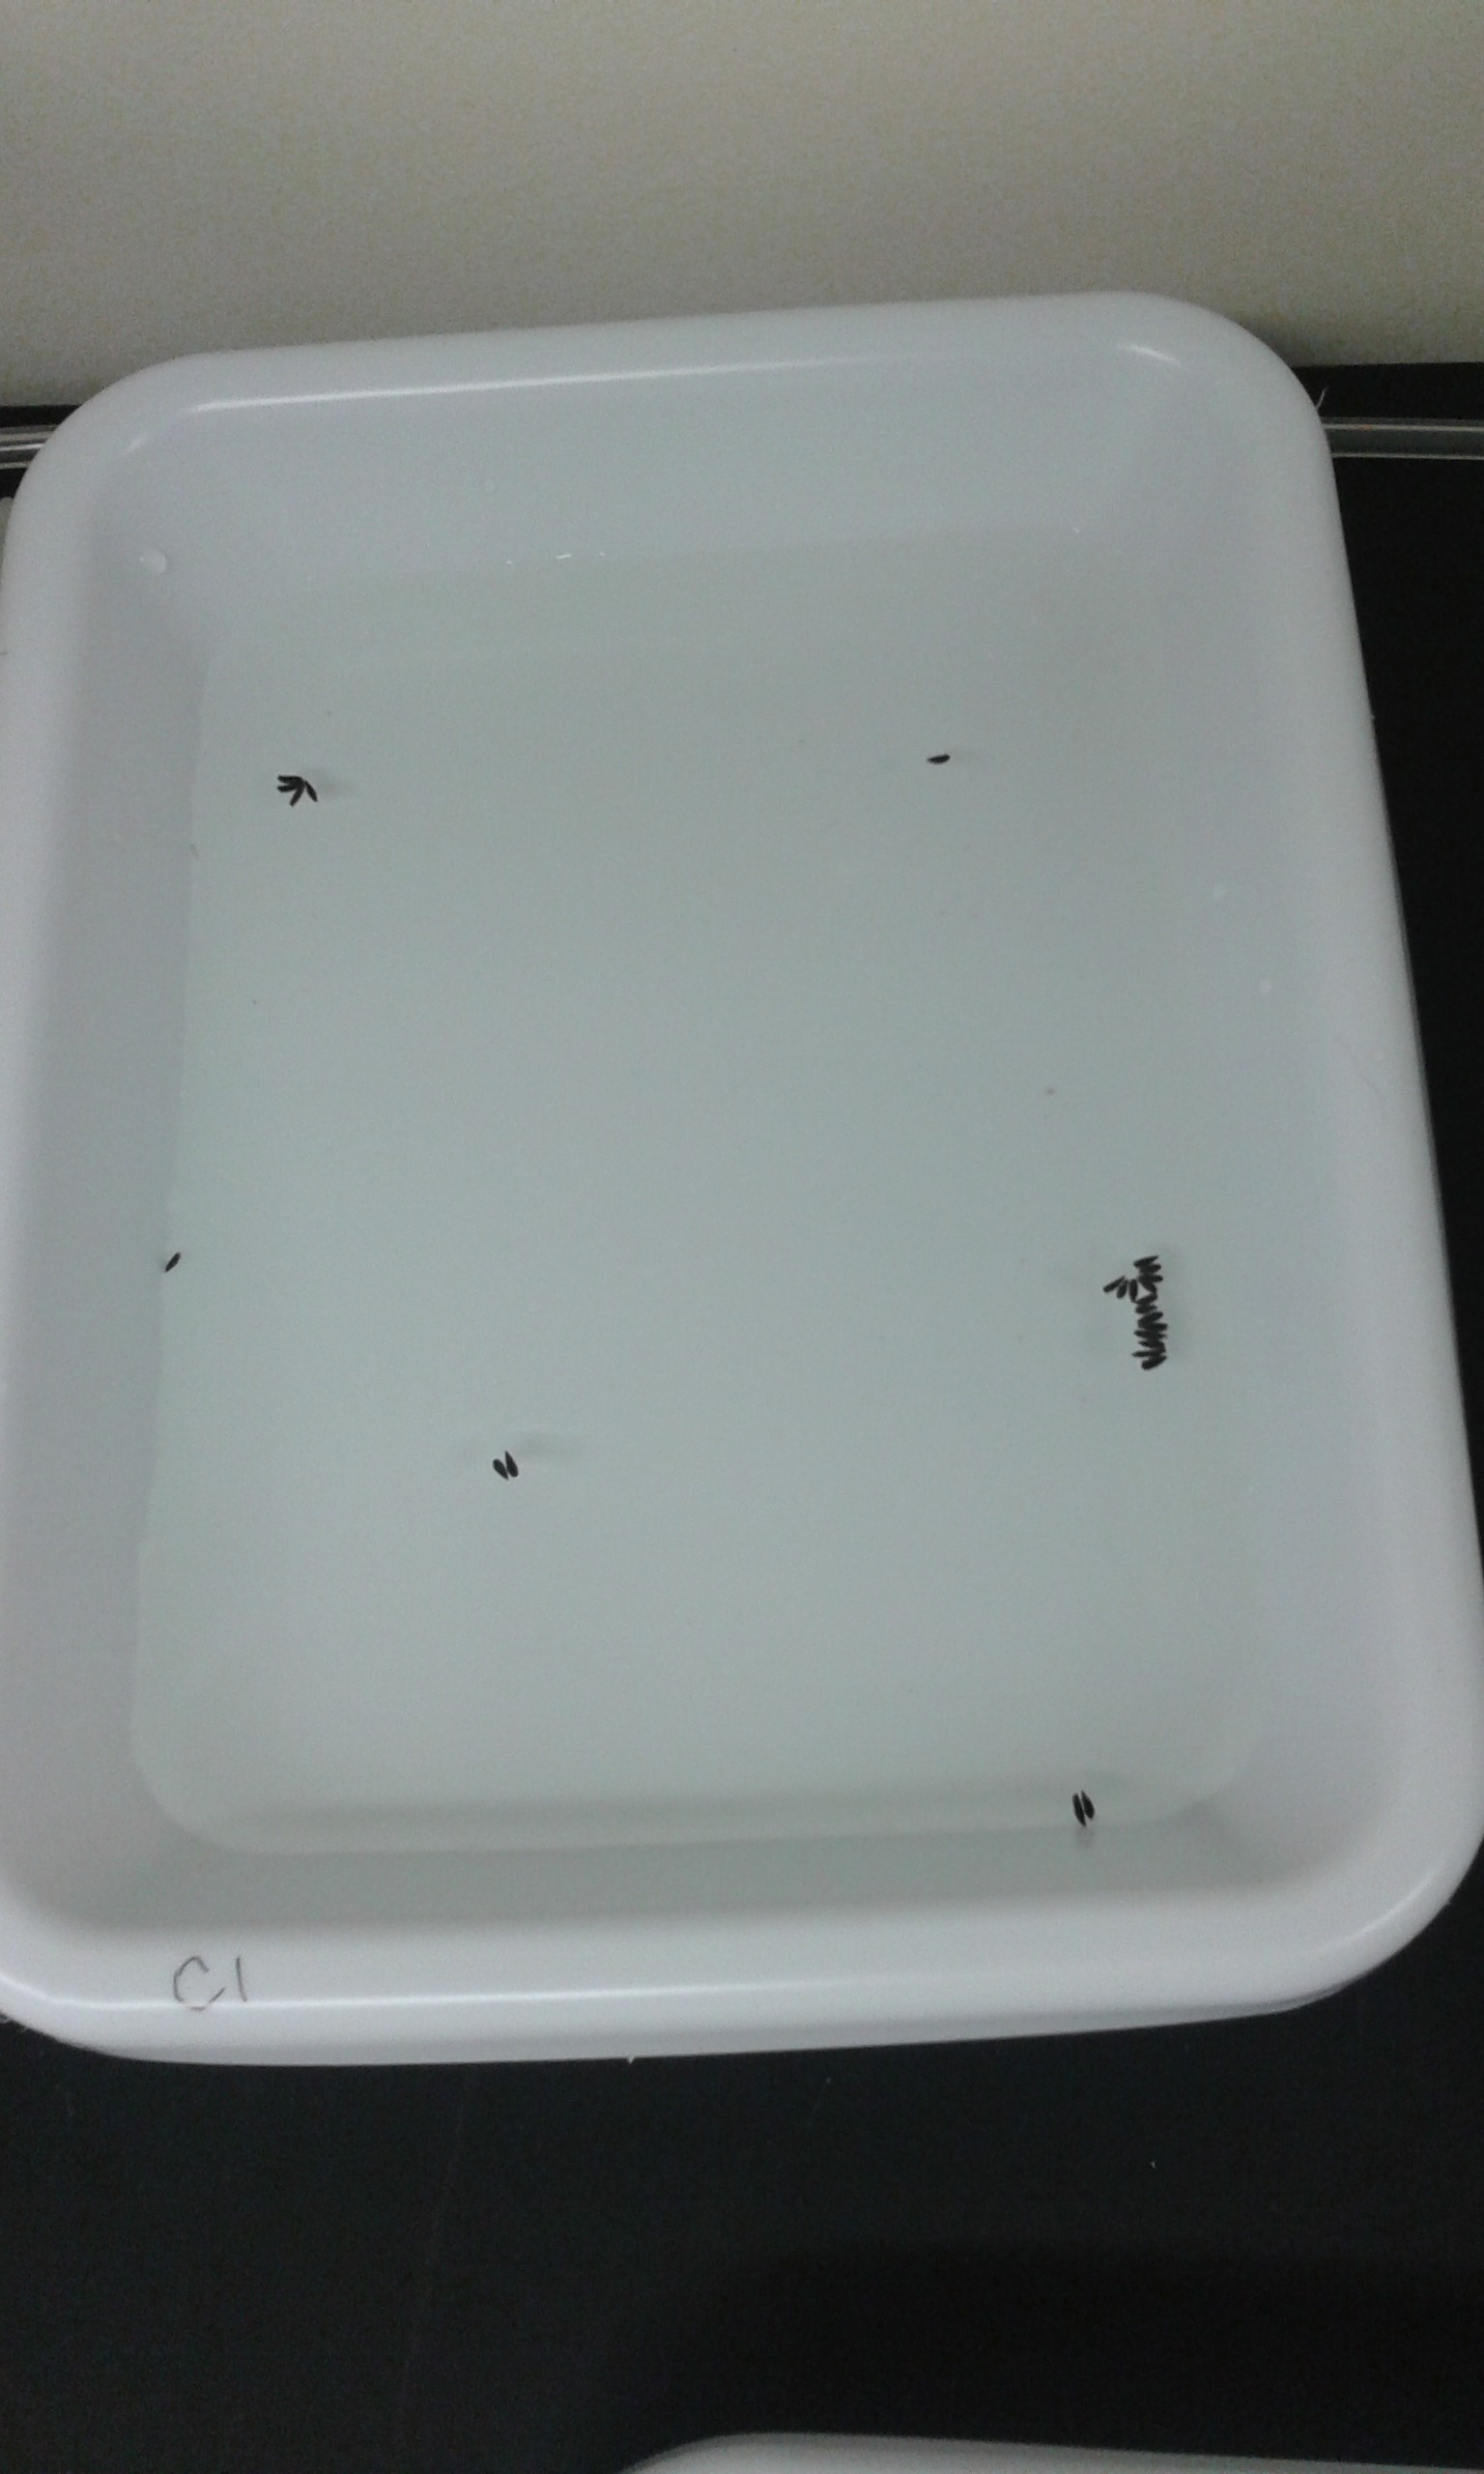
The last year has been up and down in terms of establishing a Culex colony in the lab.  We have learned a lot though.  It is critical that they be able to reproduce in the lab in order to maintain colonies.  When we got our first egg raft (the females lay eggs on water in floating "rafts") it was cause for celebration for the lab.  However, we almost lost the colony twice over the summer.  We are trying to keep the descendants from the original ones that reproduce in the lab going and add in fresh wild individuals to prevent inbreeding depression until they are lab adapted.  Jolene has been working on increasing the numbers and we now have individuals in four separate cages in two incubators.  She is now working with ways to get eggs "on demand" because the microinjection procedure can only be done with very fresh eggs.  She arranged this over the last week and expected some eggs this morning.  There were 35 new egg rafts when she came in!  Each raft can easily have 100 eggs so we had well over 3,000 eggs this morning to work with!

20140819_084131

There are 25 rafts in this one tray alone!

Update: The next morning there were two smaller rafts.  That puts the number of Culex eggs in the colony this generation at approximately 3,650!

Boards full of equations

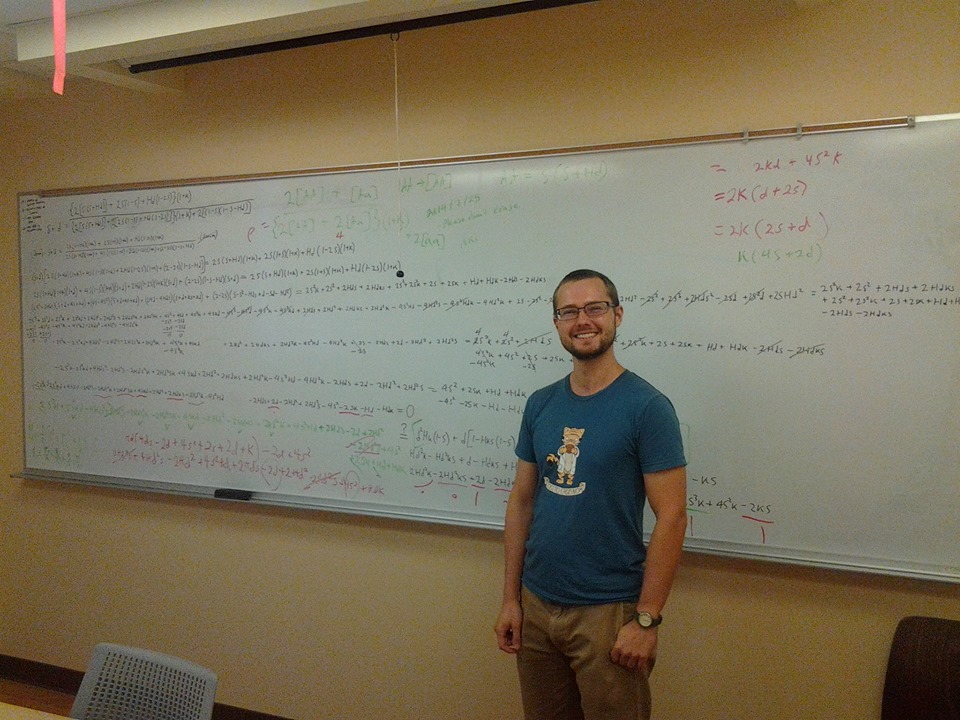
SympatricEquation
Above is a photo of Áki Láruson working on a model of sympatric speciation (photo used with permission from Áki).  Áki is studying speciation and evolution in sea urchins, which includes diving, collecting, dissecting, microscope, and wet lab work; however, another part of what many of us do is to work with and try to better understand mathematical models of evolution.  It can get messy, and often takes a lot of patience and time to think through the process.  I have filled up many boards like this in the past (and Áki has another board full on the other side of the room out of camera view).  Often starting from something fairly simple you end up at a point that is very messy, but sometimes, just past that point, things start to work out and simplify, and you discover something new and insightful---or weird and interesting---or both.

Polytene Chromosome Imaging

One undergraduate in the lab, Kenton Asao, is interested in chromosome evolution and has been troubleshooting protocols to prepare insect polytene chromosomes for imaging.  I worked with polytene chromosomes many years ago in grad school---but not since---so I am quite rusty and need to brush up on this myself, and this is something we would like to be able to routinely do in the lab.  Long story short, it wasn't working starting out so we sent some photos (to make sure we were dissecting out the right tissues) and asked for some advice from Kevin Cook (D. of Biology, Indiana U.) who kindly sent us his protocol.  We continued troubleshooting and we were getting quite frustrated trying different stains and imaging approaches but nothing seemed to be working (we also asked for advice from Gert de Couet in the department here at U.H. who loaned us some different dye and reagents to try out).  In the meantime we tried extracting DNA and doing some PCR for some damsel flies and that didn't even work...!  Then this morning Kenton found me and said that he needed to show me something.  After taking a look I went back to my office to get our microscope camera and set it up to record some images.

Some background.  Generally chromosomes are very tiny and difficult to image with standard equipment.  However, some cells undergo endoreduplication where the chromosomes divide but the cells do not.  In some of our muscle and liver cells there are actually four (tetraploid) or eight (octoploid) copies of each chromosome instead of the normal two copies (diploid--one from each parent) that we are used to thinking about.  In older fly larvae that are about to pupate and metamorphose into adults the salivary gland chromosomes divide approximately nine times resulting in 512 copies of each of two starting chromosome copies or about 1,024 total copies per cell.  In addition they stay physically associated with each other so that they form large (gigantic on a cellular level) structures.  Each individual chromosome is made up of about half DNA (actually a single very long strand of DNA) and half proteins that organize the DNA into the structure of the chromsome.  The density and composition of proteins changes along the chromosome so that different regions have different staining levels that result in a banding pattern.  In polytene chromosomes all 1,000+ copies are organized together into these large structures.

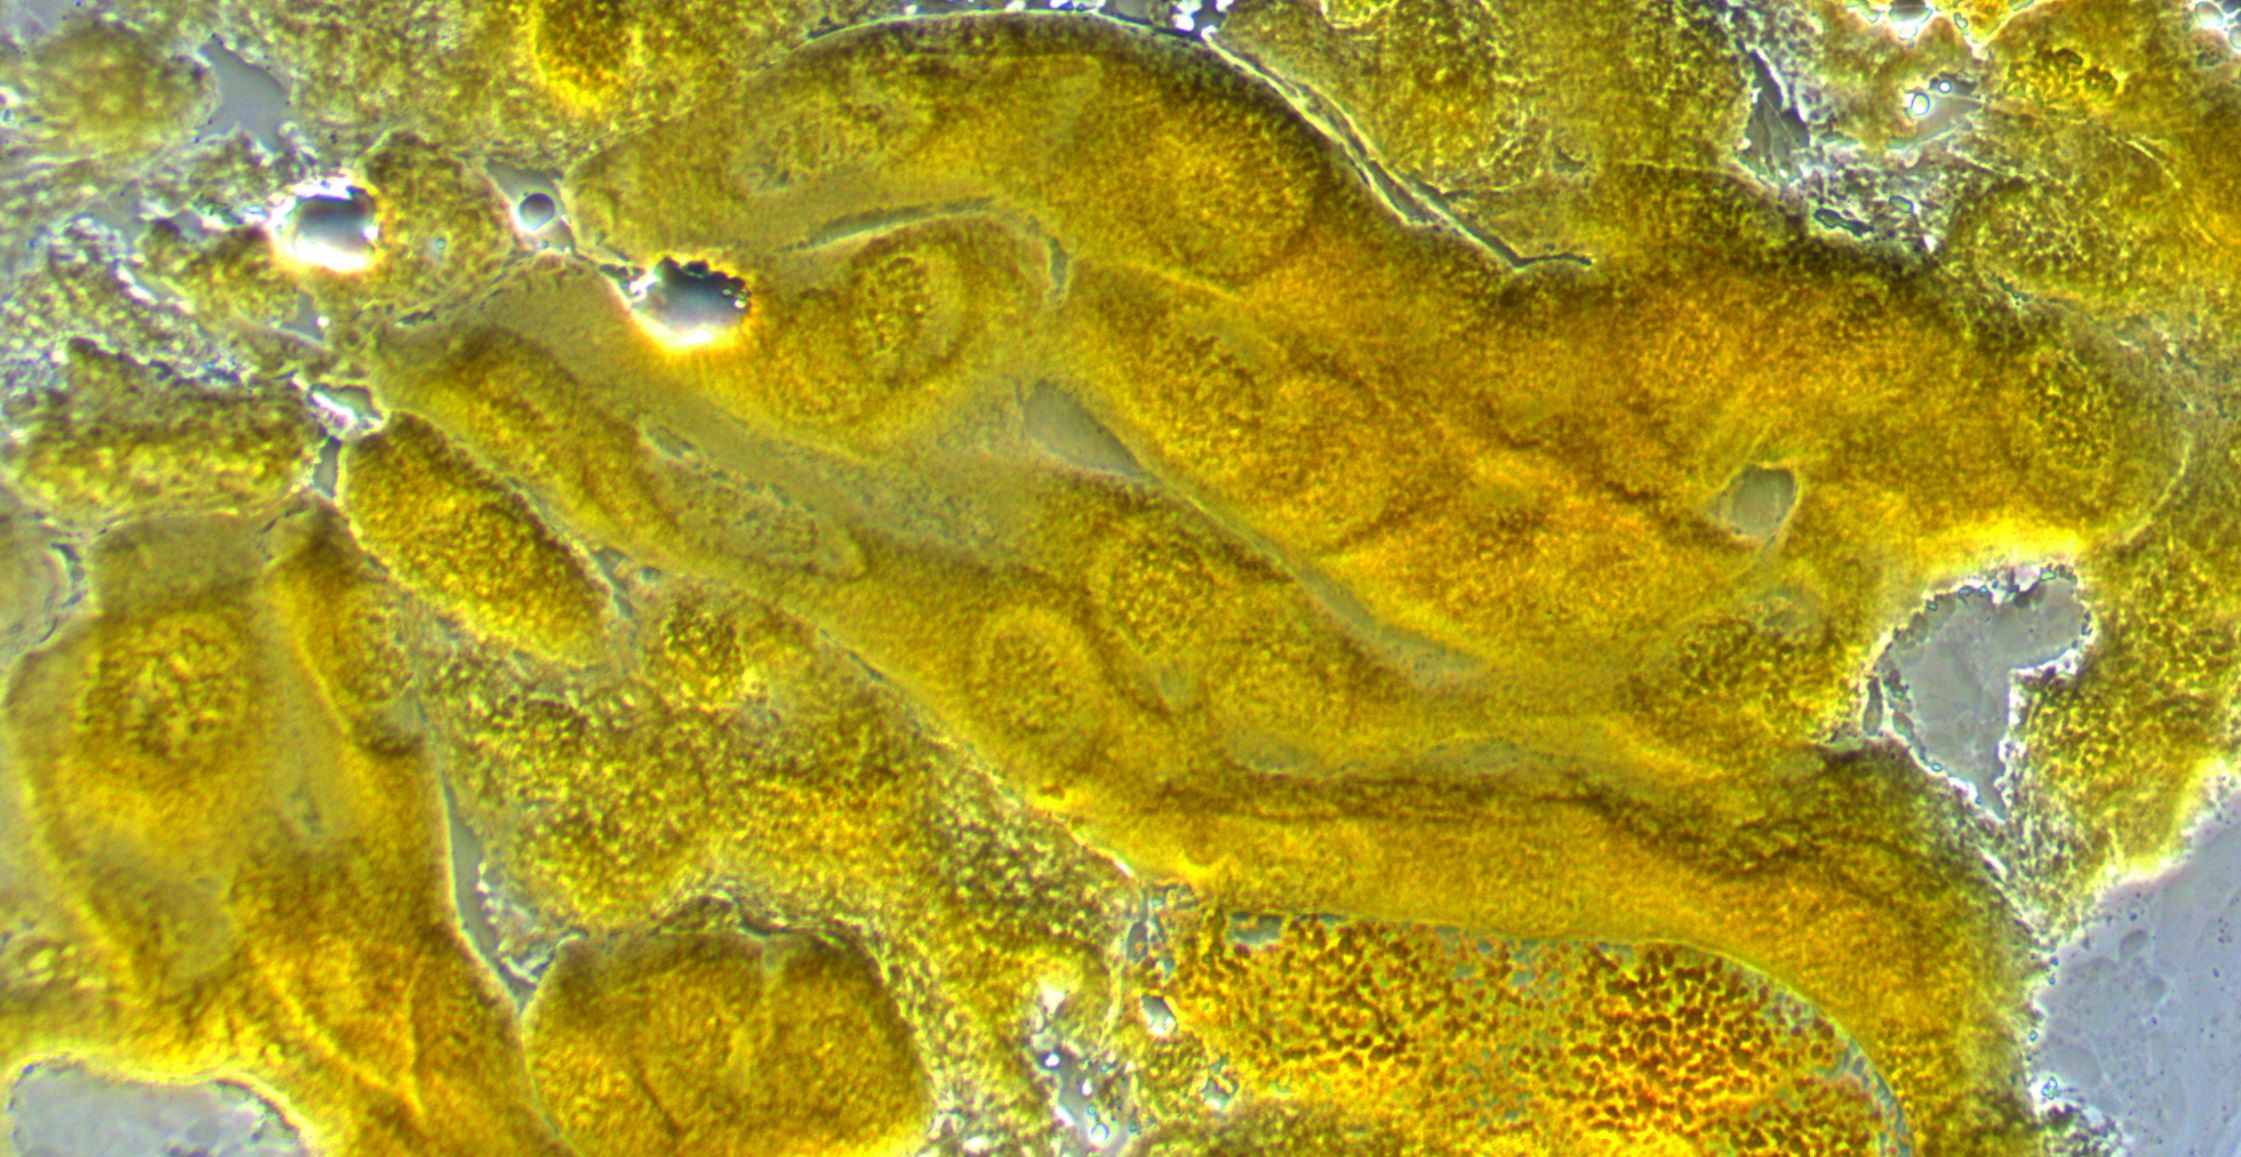
This first image below is of some cells in larval salivary glands under the microscope.  Within the cells you can make out the nuclei and maybe the first hints of the darker chromosome structure.

dmel-polytene-2014-07-28-11-55-11-cells

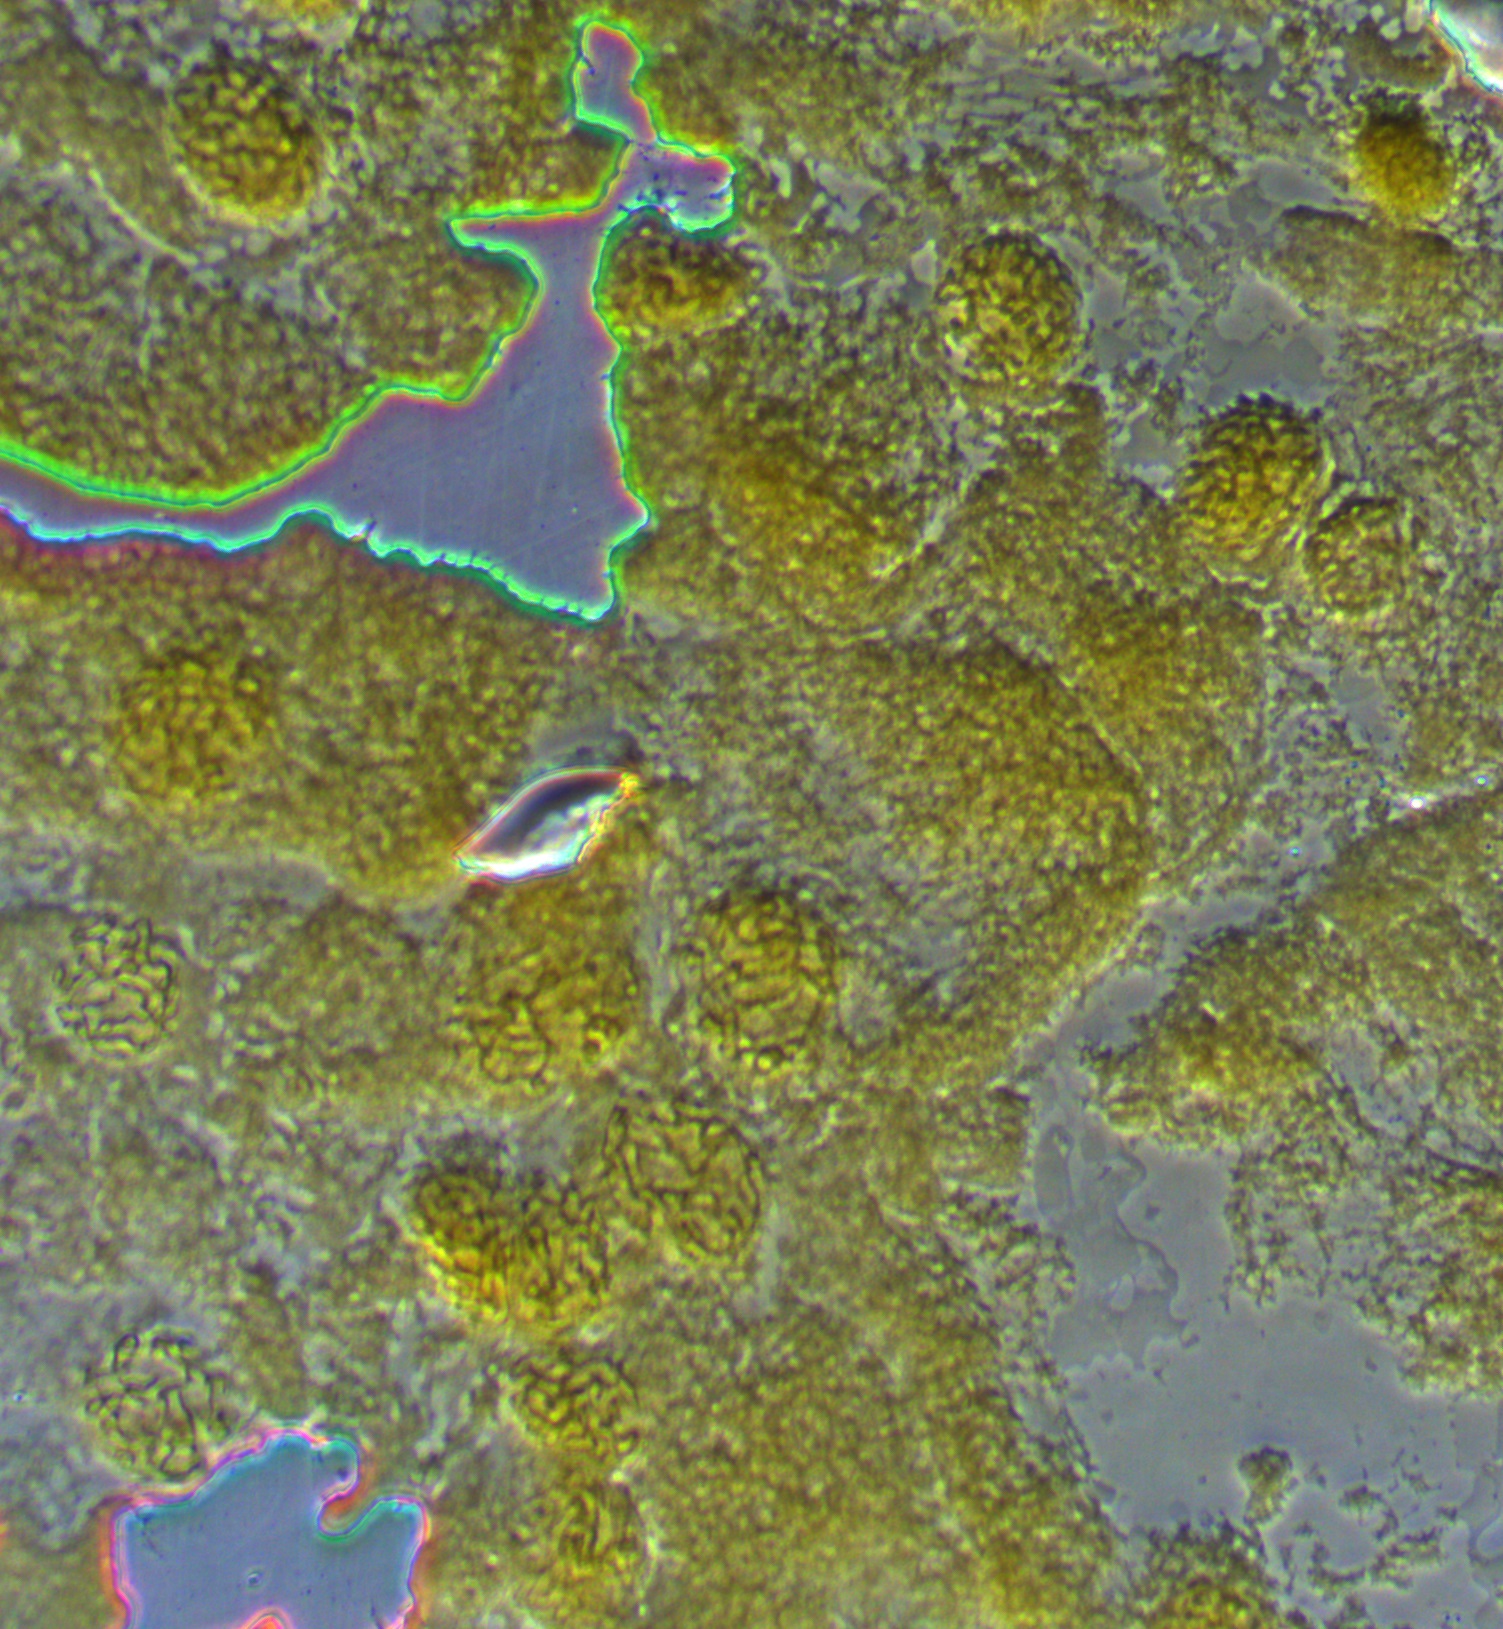
The next image is with higher magnification.  You can see the cell nucleus as spheres with darker chromosomes winding around.  In preparing the tissue for these images we apply a lot of pressure to purposely try to rupture the cells and spread the chromosomes (i.e., this is not necessarily what they would normally look like).

dmel-polytene-2014-07-28-12-01-18-nuclei

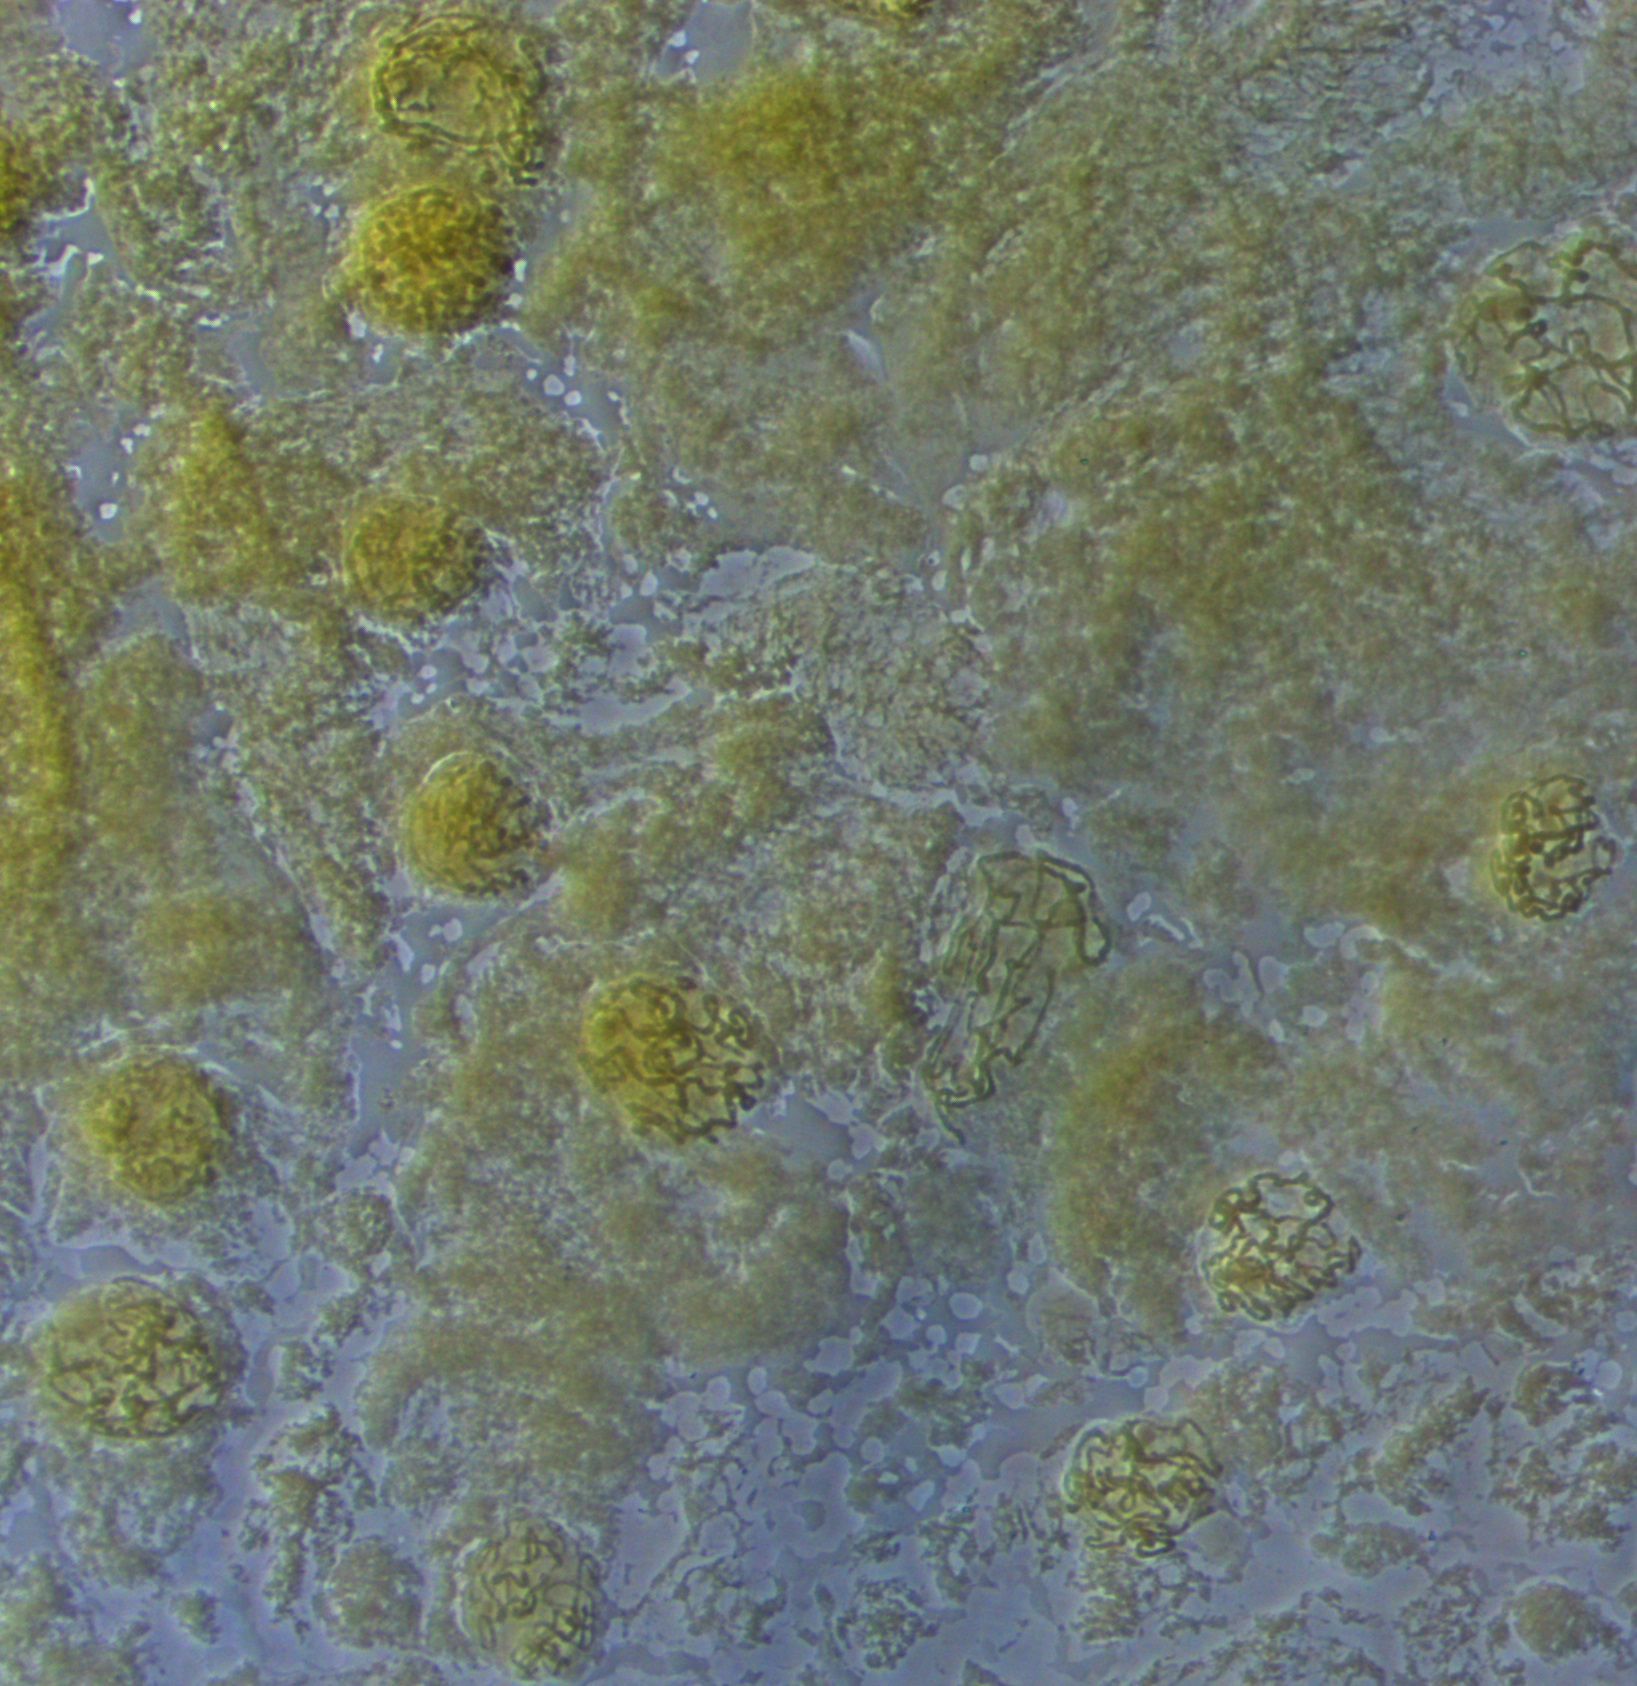
In the image below one of the nuclei has been squashed and "spread" a bit more than the others.  The chromosomes look like darker squiggles.

dmel-polytene-2014-07-28-12-06-44-nuclei

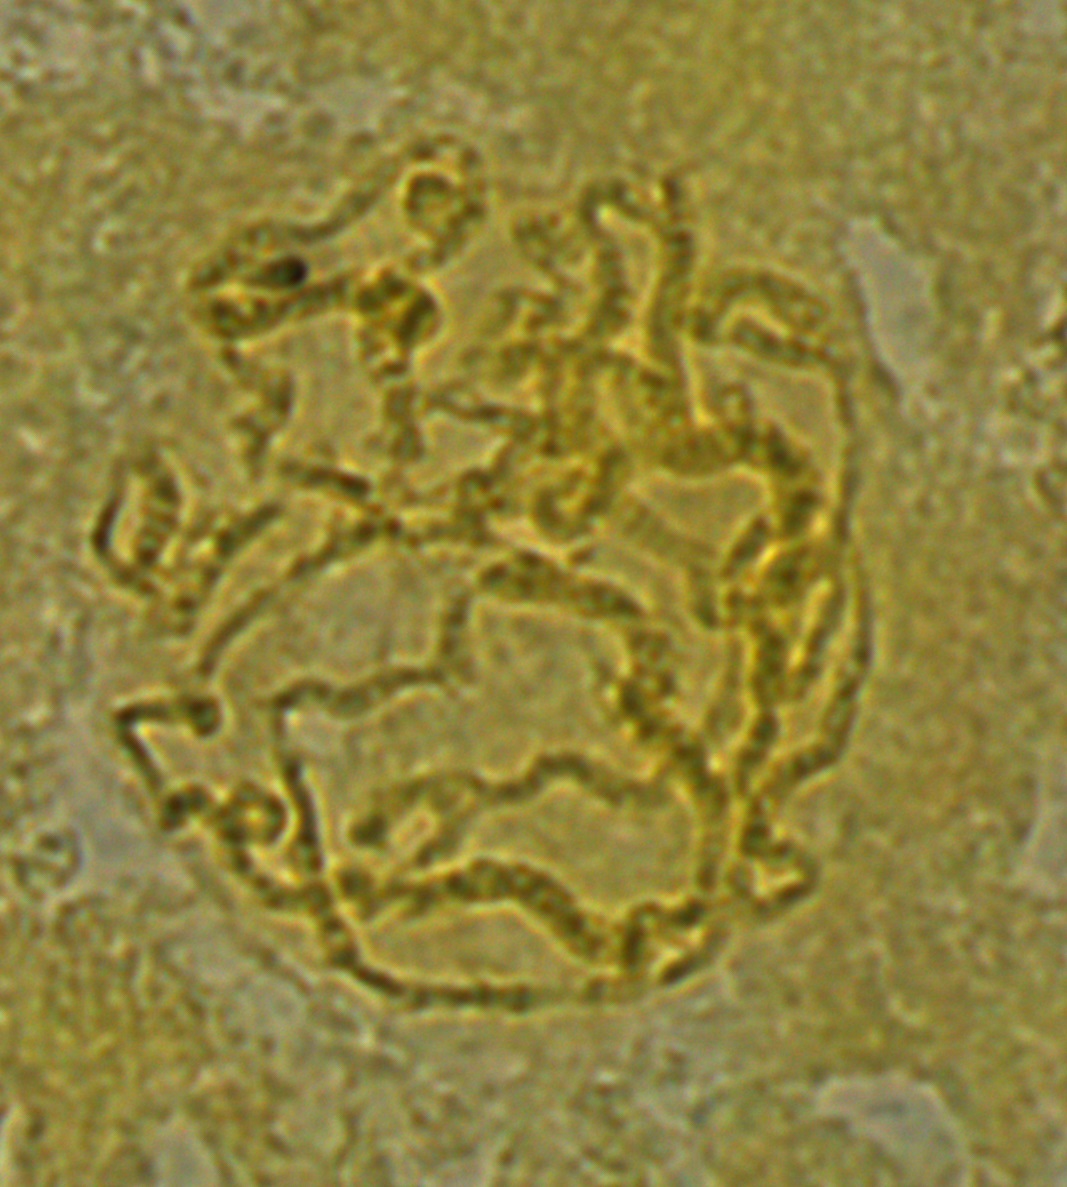
The image below is zoomed in to an even higher level.  You can start to make out the dark and light banding pattern along the chromosomes.

dmel-polytene-2014-07-28-11-59-22-chromosomes

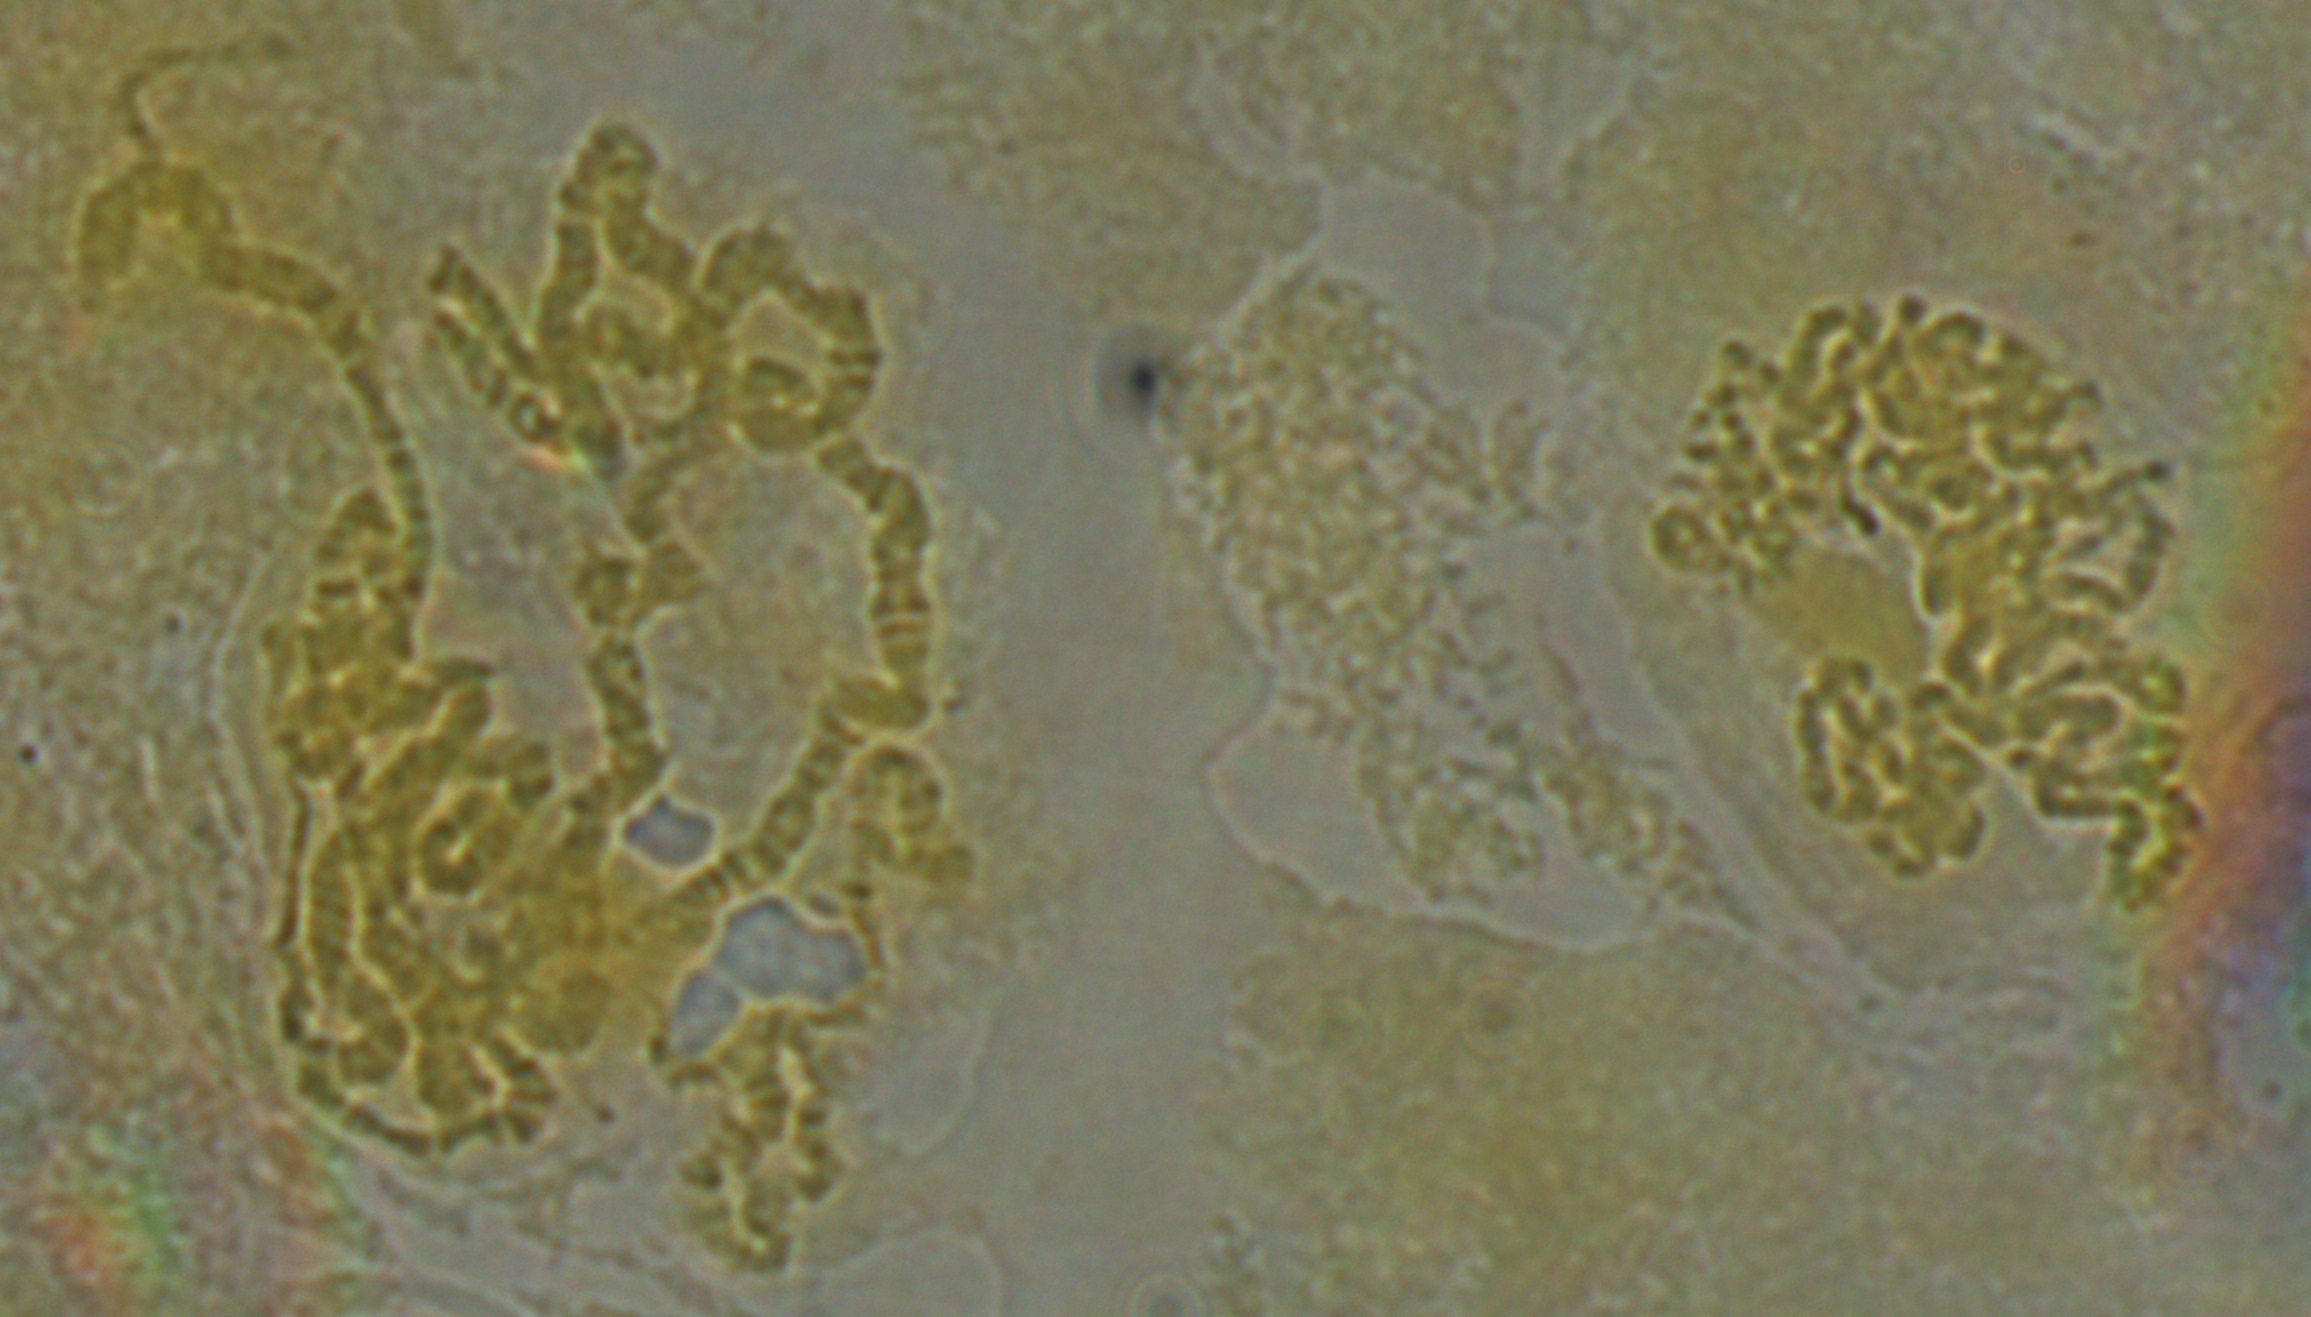
Below are two nuclei.  The one on the left has been spread more than the one on the right, and the banding pattern is easier to make out---at least for the section that is spread.

dmel-polytene-2014-07-28-12-03-43-chromosomes

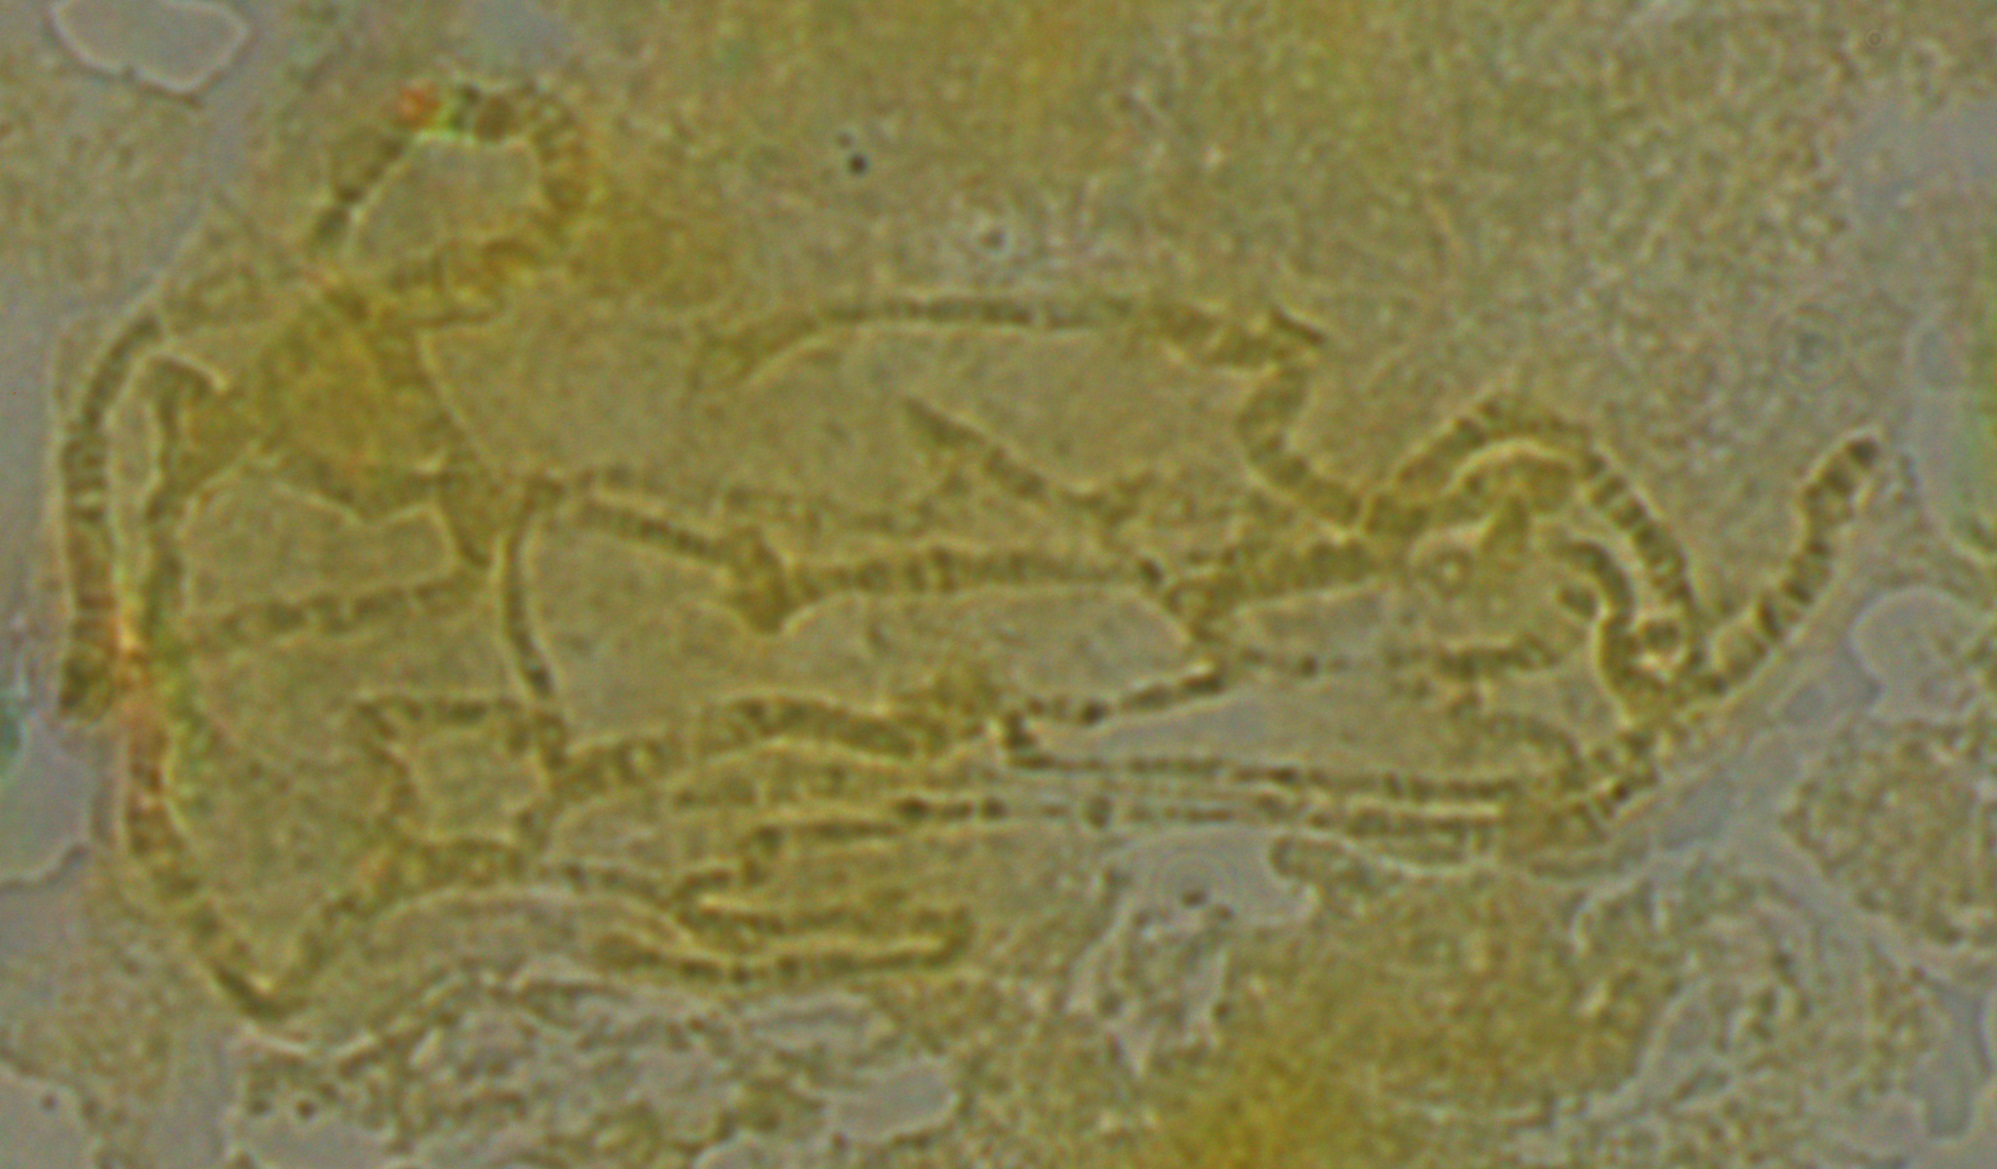
In the image below it looks like some of the strands are starting to shear.  However, the end of one chromosome is visible to the right so I wanted to focus on it and see if I could identify which chromosome it belonged to.

dmel-polytene-2014-07-28-12-09-14-spread

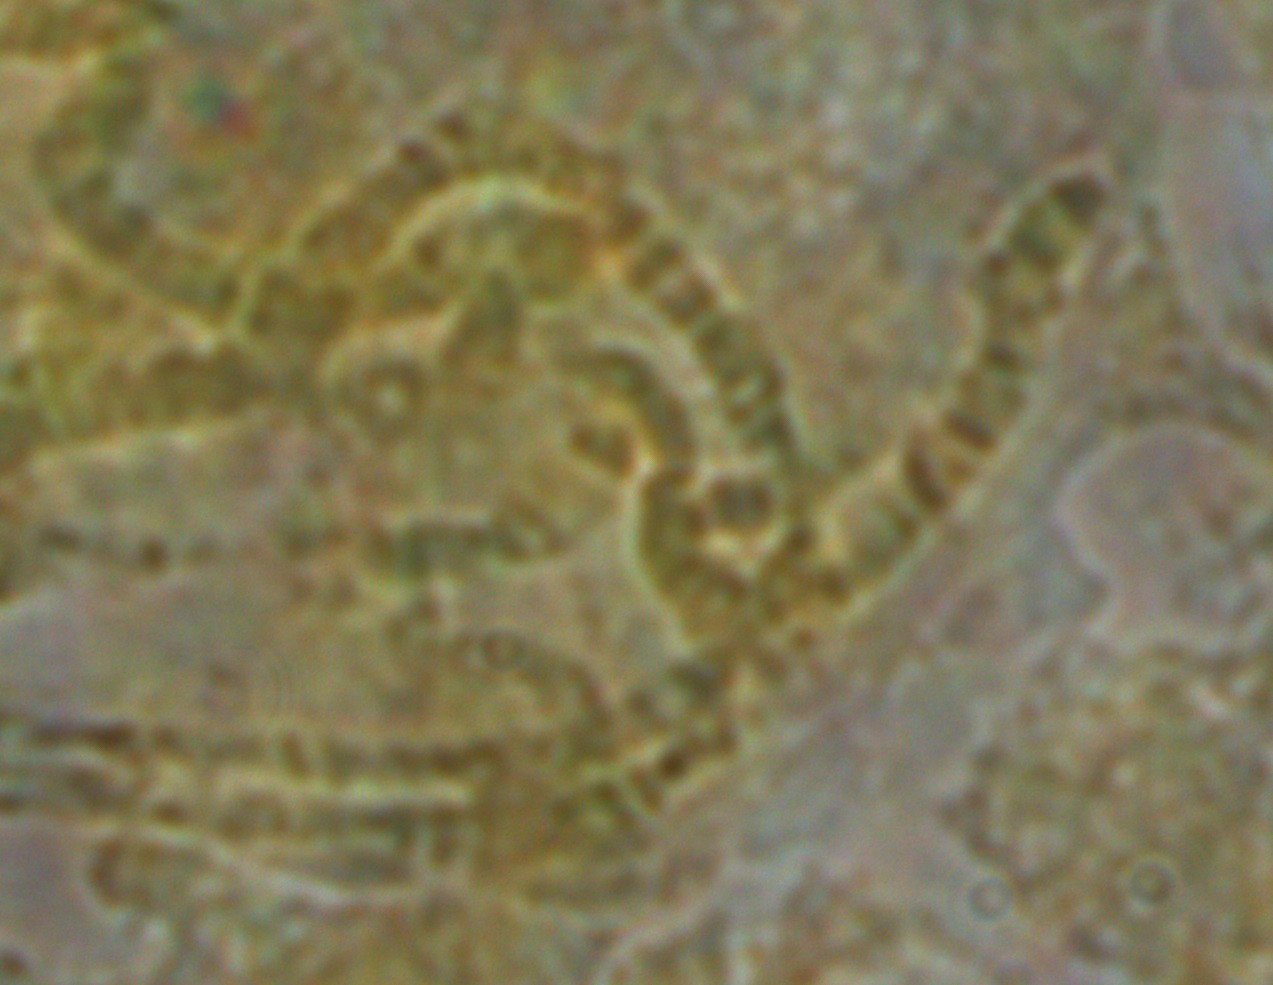
Below is zoomed in some more on this area, and this is pushing what the optics in our system are capable of.  Just down from the end of the chromosome is a "puff" where it widens out.  These correspond to areas with active transcription of genes.

dmel-polytene-2014-07-28-12-12-23-spread-detail

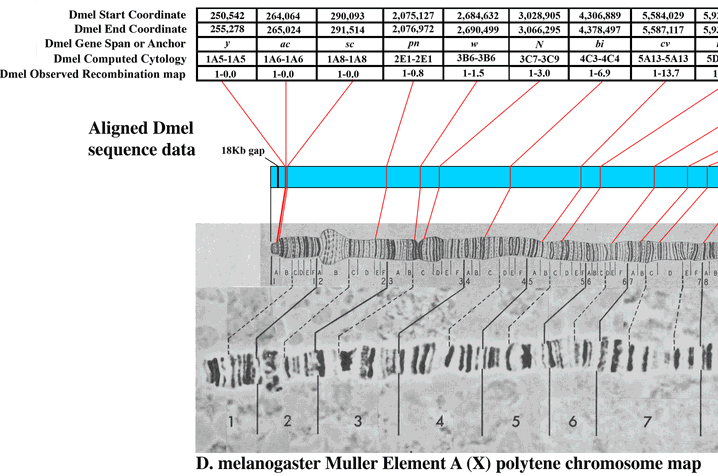
There are cytological maps of the chromosomes available at flybase to compare to.  Here is the image at the end of the X-chromosome.

Dmel-X-cyto-end

Based on the similarity in the banding pattern and the presence of the puff I suspect this is the end of the X-chromosome.  The gene yellow (y) which affects body pigment is at the very end and white (w) which results in red eyes when functioning correctly (and happens to be the first genetic variation discovered in Drosophila melanogaster by T. H. Morgan's lab) is just down from the puff at the second dark band.

Ironically the best images today were not from the orcein stained slides but from Hoechst 33258 stain, but strangely the chromosomes did not appear to fluoresce under UV light.  Kenton wrote down all the steps he took today and the most important thing for now is to replicate the process tomorrow to make sure we can get good images of the chromosomes.  Then we will try to fine tune and troubleshoot some more.

Onward to Sydney and then back to Hawai'i

After Melbourne Jolene and I flew to Sydney to attend the GSA annual meeting where both of us gave presentations.  I talked about our plans with underdominance here in Hawai'i and Jolene talked about her work with immunity gene diversity in some island bird species.  After the meeting I returned to Hawai'i but Jolene is traveling on to New Zealand for an invited talk at Otago.