The idea that ancestral lineages come together (coalesce) at some point in the past is a powerful and useful concept in population genetics. We inherit our copies of our genes from a finite number of ancestors. If we randomly picked two copies of a gene in the population there is a chance each generation back that they are inherited from the same ancestral copy.
The number of copies of a gene in the population is twice the population size, or  . For example I have two "non-taster" alleles of the gene TAS2R38 and can not taste PTC. These alleles are found all over the world. If we look at the allele I inherited from my father, there is a chance that another random copy picked from the present human population is also inherited from the same copy from my father (by my brother or sister). Moving further back in time my lineage intersects with my close cousins so that we inherited the same copy from our grandparents or great grandparents. Even further are distant cousins with connections via more ancient common ancestors, and ultimately all modern humans and common ancestors hundreds of thousands of years ago. Even the "taster" and "non-taster" allele branches are united in a common ancestor with some mutations along one lineage that converted a "taster" ancestor into a "non-taster" allele for people around the world to inherit.
On the simplest level, this probability of inheriting the same copy one generation ago is  , or one out of the total number of possible gene copies to pick from (assuming the population size is a constant
  each generation). Once ancestral lineages come together to the same copy they cannot "uncoalesce" and split back apart; so eventually all lines of inheritance will trace back to one common ancestor in the distant past.
This describes an exponential "waiting-time" process, like radioactive decay or the example I talked about earlier with non-reversible mutations; however, this looks back in time to when an event happened instead of the time until it will occur in the future. In my class I often use flipping coins or rolling dice as examples to illustrate this. The chance of rolling a "three" on a die is  so on average you need six rolls to get a three. The chance of "tails" from flipping a penny is
  . You could get this on the first try, or it might take a few tries, on average it takes two coin flips. This is a shared property of all exponential distributions (technically it is actually a geometric distribution because we are thinking of discrete generations, but with a large population we can assume a continuous time approximation and use the exponential). The rate of coalescence of two lineages each generation is
  . So, on average we wait a total of
  generations until the copies came from a common ancestor. (The mean of an exponential distribution is the inverse of the rate parameter.)
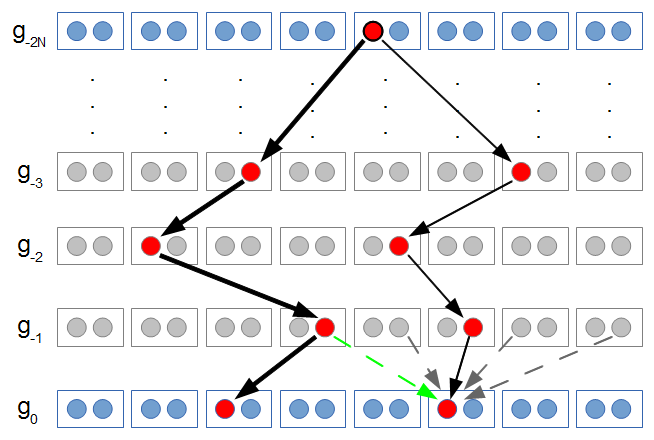
In the figure above copies of a gene are indicated by circles. They are in pairs in each individual (rectangles). I randomly pick two copies to compare in the current generation (red circles in the  row). The first copy on the left has a line of inheritance traced back to earlier generations by the thick black arrows. There is a chance (
 ) that the second copy coalesces with the first in the previous generation (suggested by the green dashed arrow) but there is a much higher likelihood that it does not coalesce (
 , suggested by the gray dashed arrows). In fact we expect coalescence to happen, on average,
  generations in the past.
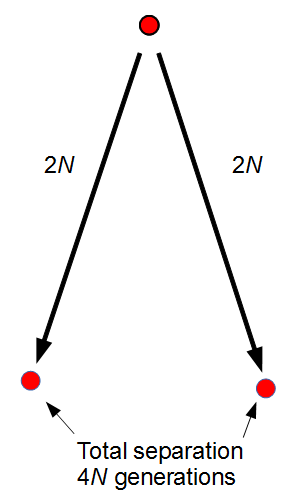
The total distance between two copies in the current generation is, starting from one,  generations back to the common ancestor and
  down to the other copy. This is a total distance of
  generations.
If we include a per generation mutation rate of  to trace along this lineage with an average length of
  , we expect an average difference (or an average heterozygosity) in the population between two copies of a gene of
  (if each mutation affects a different nucleotide in the gene sequence so we see all of the events, which is generally expected for short time periods). This measure of genetic diversity is a function of both the population size
  and the mutation rate
  . Larger populations can accumulate more diversity before it is lost due to genetic drift and higher mutation rates introduce diversity at a greater rate. This value of
  comes up frequently in population genetics and has its own symbol,
  .
.
For example, looking at the same thing in a different way. The number of new mutations at a gene in a population each generation is  . There are
  copies of the gene in the diploid population and the fraction
  of them are expected to mutate each generation:
  .
.

