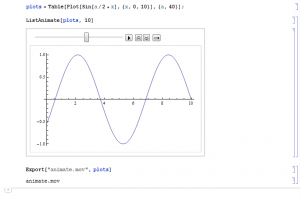
One thing I've wanted to make available for years now is a user interactive way to illustrate evolutionary dynamics--specifically underdominance. I have been using Mathematica for about six years now and tried exporting a video of a table of plots that sequentially increment a value. This example is just of a sine wave, and it is not interactive, but it is a first step.
Sine Wave Animation (Click link to see animation.)
...and below is a screen capture of the Mathematica notebook to create the animation.
