The basic idea of DNA barcoding is that essentially every species has a unique DNA sequence that is diagnostic of that species. It is inefficient to sequence different genes for comparison of different samples or even whole genomes, so it makes sense to pick a common place in the genome for comparison across species. A great deal of effort has gone into determining the best gene sequence to use for barcoding. It should be variable enough that essentially all species are unique, but not too variable (at least in the primer binding regions) so that the same set of primers can work in almost all species and that reasonable sequence alignments can be made to compare species.
Why? Many species are described at only one stage of their life cycle. In many insects the larvae look alike but the adults are completely different from each other (or in one famous case the opposite is true, link). Similarly, many marine fish have tiny larvae in the plankton that look nothing like the adult forms, and there are cryptic look-alike fish species. There is an organized effort to barcode as many fish species as possible (link). And take the example of mushrooms. The much more common mycelium fibers growing in soil look nothing like their occasional fruit---the mushrooms that we are used to. Also, there is the problem of identifying what unobserved species are in an environment from the DNA they leave behind in the soil or water. In many cases, like monitoring the species in the environment, and understanding which environments are important throughout a species' life-cycle, it would be helpful to be able to connect the dots and to know precisely which described species are present at different developmental stages or just in general.
Also, in a more forensic sense, it is handy to be able to test food and find out which species it comes from. There are laws about which species can be harvested and how food ingredients have to be advertised. DNA barcoding provides a useful and powerful way to verify the claims of a label (e.g. link).
Finally, there is a educationally valuable, direct, tangible connection for the students; a sample they find themselves and decide to select connects to modern molecular biology in the lab and then the results connect to the natural history of evolution on our plant that ultimately connects all living organisms.
However, DNA barcoding has been surprisingly polarizing; it has plenty of lovers and haters in biology. Classical taxonomy is a skill that takes years to develop for a specific group of species of the taxonomist's specialization. Some see DNA barcoding as a cheap and easy way to circumvent this process, resulting in a rapid naming of different species in a sample with no real deeper understanding of the important differences between them. Like any new technological approach there will be an adjustment period as DNA barcoding finds and settles in on its role in biology.
(For more background information about DNA barcoding see the iBOL website, the introduction at CBOL, CSH's barcoding 101, and the DNA barcoding wikipedia page, which includes a discussion of criticisms that are not as forthcoming on the other websites.)
I am teaching a genetics course with a laboratory component (with the first lab last fall semester). In my research lab we started using DNA barcoding to identify which species were present as mosquito larvae in standing water. I expanded this to test some other species I came across and decided to include this as a project for the undergraduate students. In many ways, Hawai'i is one of the most uniquely diverse places on the planet, so describing this diversity capitalizes on a natural strength of Hawai'i.
COI, cytochrome c oxidase I, found in the mitochondrial genome, has, for various reasons, become the standard barcoding locus for animals. Both matk and rbcL have been promoted as barcoding regions in plants and ITS in fungi. We have settled on rbcL for plants because the PCR amplification is more reliable (in our lab experience) over a diverse range of plants than matK. We have not tried fungi samples yet but may include them soon.
Last semester I asked the students to bring in a (legally and safely obtained) tissue sample for DNA barcode testing. We spent some time, effort, and resources on this and I don't want the results to simply disappear at the end of the semester, only existing as a student experience. So, I have been curating the results and adding them to an online database so that researchers and students all over the world can access the results and use them in their own research---including a growing resources for students to compare results to in our teaching lab. This has been somewhat on the back-burner as a free weekend project and I have just now finished submitting the animal samples. There are even more plant samples, especially flowering plants, that I expect to finish curating this summer. So, this post is to talk a bit about the initial results focusing on the animal samples.
Also, in another sense, I am also trying to learn more about the natural history of Hawai'i, and have my own gaps in understanding of species taxonomy---especially in the tropics. Generating DNA barcodes from samples collected here provides a focus to help fill these gaps in. Without this focus, on working out the relationships of the few species at hand, the bigger picture is too overwhelming. This creates a backbone for us to connect new species to as we come across them in the future.
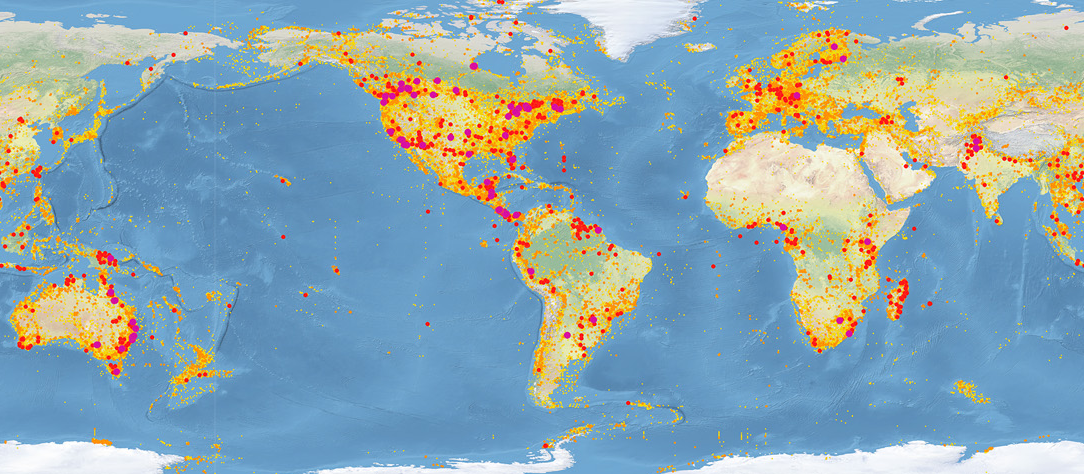
The BOLD Systems (Barcode of Life Data Systems) website is a publicly searchable repository of DNA barcode data. In addition to the sequences you can also record the exact location a sample is collected from, when it was collected, an image of the sample, etc. On their front page there is a map highlighting the geographic distribution of samples in the database.
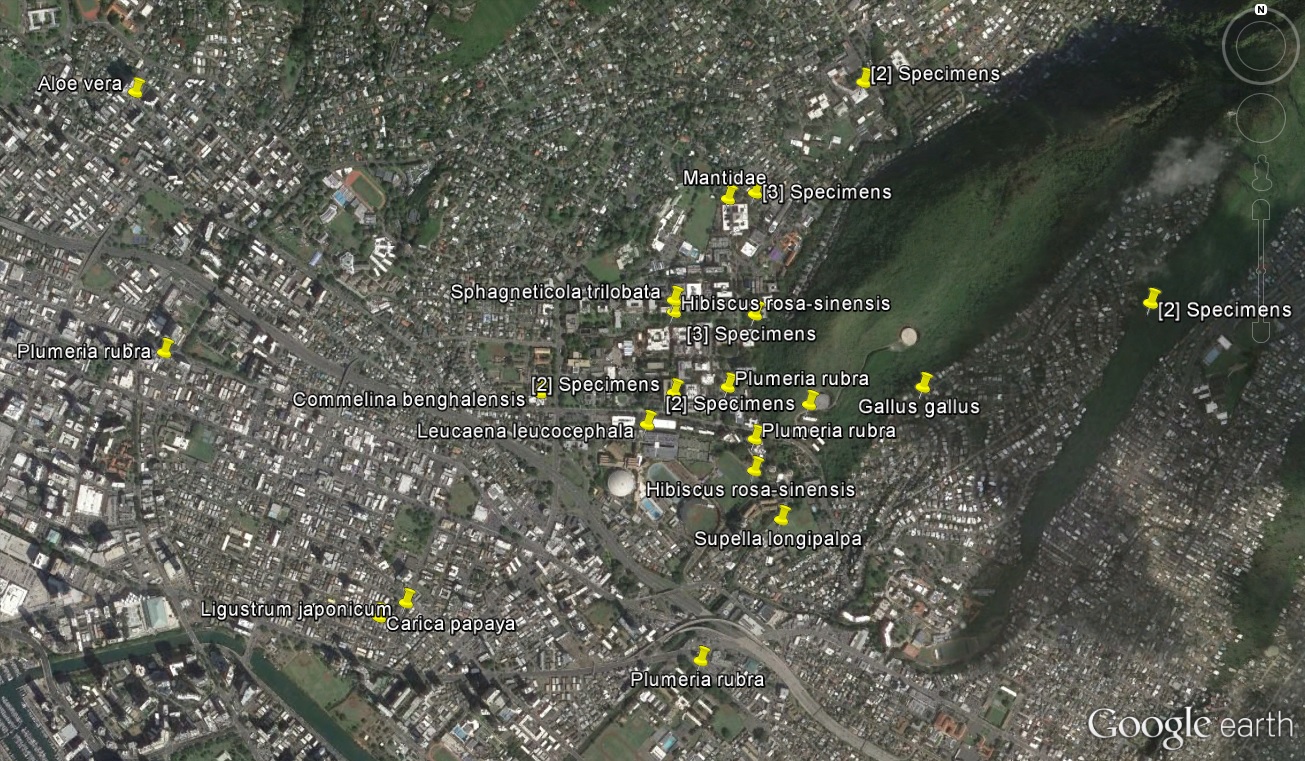
We are contributing to the purple dot over O'ahu in Hawai'i. Zooming in, here is a map of our samples in O'ahu.
And even closer showing the Honolulu/Manoa region around campus.
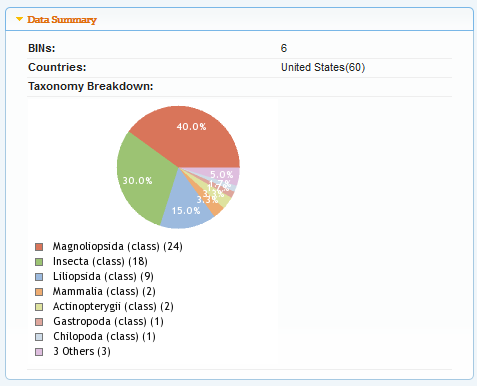
Currently we only have 60 samples in the online database, but I am expecting that to quickly grow as we optimize the lab project. Here is a summary by taxonomic class.
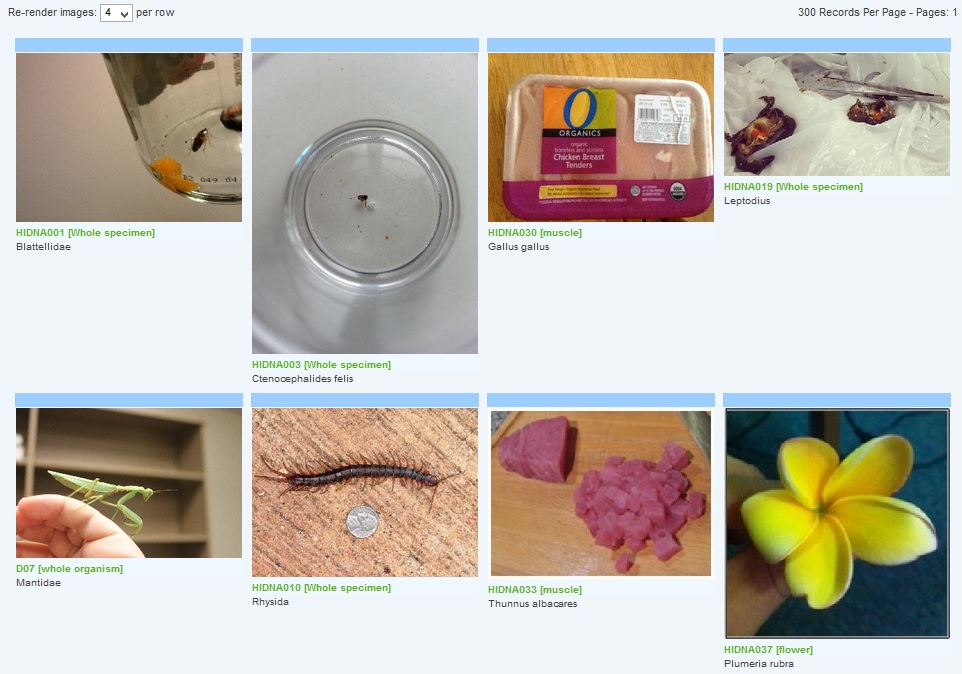
40% of the samples are from flowering plants (Magnoliopsida), while 30% are, not surprisingly, from insects. There is also a project image browser.
And summaries of the data like this accumulation curve.
This shows the slightly diminishing returns as our sample collection progresses. For 60 samples we have (at least) 37 unique species represented (however, several samples could not be identified to the species level). Some species are beginning to be sampled more than once.
I organized the samples taxonomically, again currently only the animal ones, on this page (link) (the page is currently a draft and will need some rounds of cleanup and revision) with links to aid learning more about each taxon and links to the BOLD entry for each sample. I also indicate if the species is native, endemic (only found in Hawai'i), brought here by the ancient Polynesians, threatened or endangered (students are given clear guidelines about what they can and cannot legally collect (no coral, no vertebrates except under special conditions, no threatened or endangered species, etc.) the endangered samples in the database were obtained legally (students are also given common sense safety guidelines for collecting)).
Many of the samples could be identified down to a species level, but some could not, which can raise a flag of interest to check out further as a possible new species. I suspect the mantis sample is a Chinese mantis (Tenodera sinensis) but I am not certain and there are some look alikes among this group so I left it as unknown at the genus and species level. On the other hand, one of the students brought in an insect that seems to fit into the cockroach family (Blattodea) but is not turning up any obvious close genetic relatives on the databases (BOLD and GenBank). A similar story goes for a Xanthid crab and for a hover fly. However, as more samples are collected and the database grows we might get some matches in the future from positively ID'd specimens that will help resolve this.
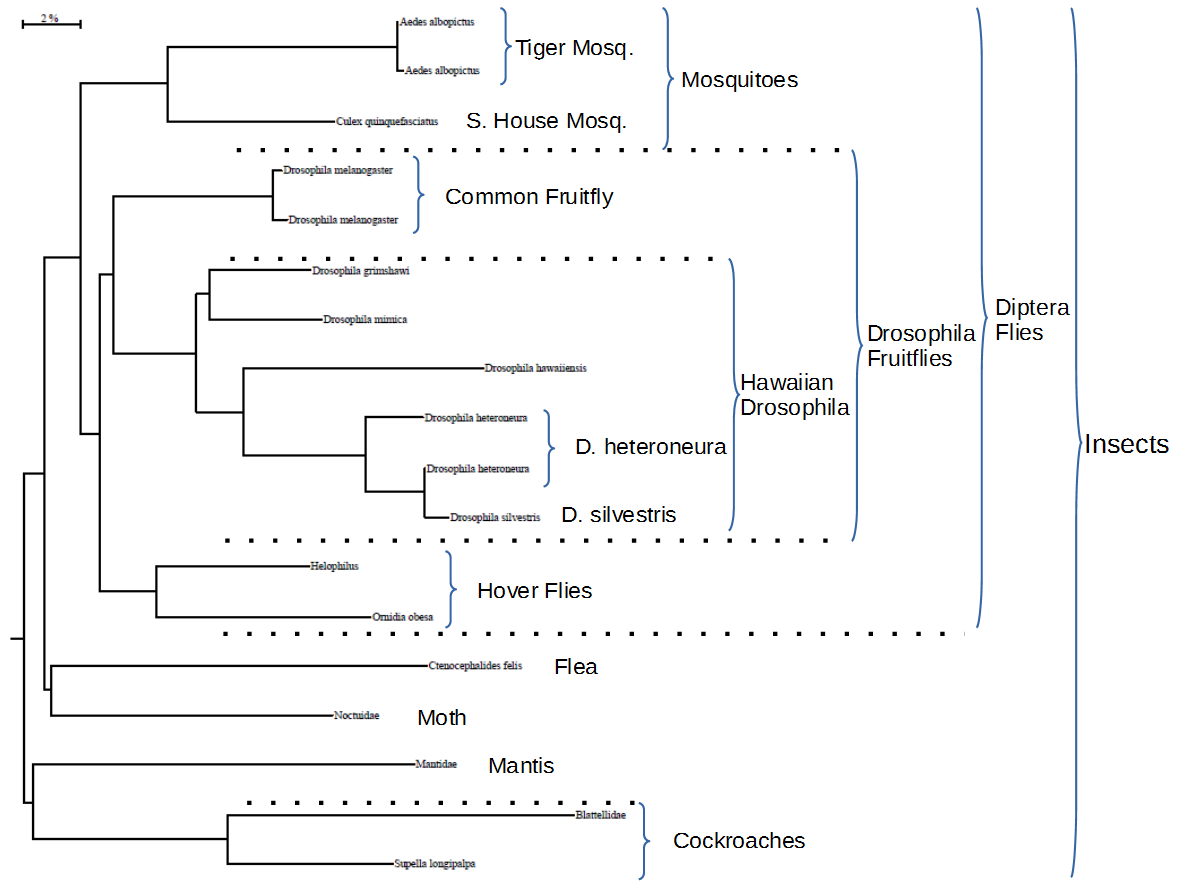
Finally, I couldn't resist generating a phylogenetic tree using our data and BOLD's online tools. DNA barcoding is not designed to behave well in terms of reconstructing more ancient relationships among species. It is aimed at resolving species identifications. So I was surprised at how well the data preformed in clustering the insect species (which contain our largest number of animal samples).
The bar at the upper right represents a distance in the tree of 2% sequence divergence. The tree is rooted with a crustacean (an arthropod but not an insect) sequence (not shown). The flies (Diptera) were grouped together and within this we get mosquito, fruitfly, and hover fly groups. Within the fruitflies we also get a Hawaiian Drosophila clade. Finally we see that one Drosophila heteroneura sample is distant from Drosophila silvestris while another D. heteroneura is quite close to D. silvestris. This is not as surprising as it might first appear because these two species are found to hybridize quite frequently in the wild.
