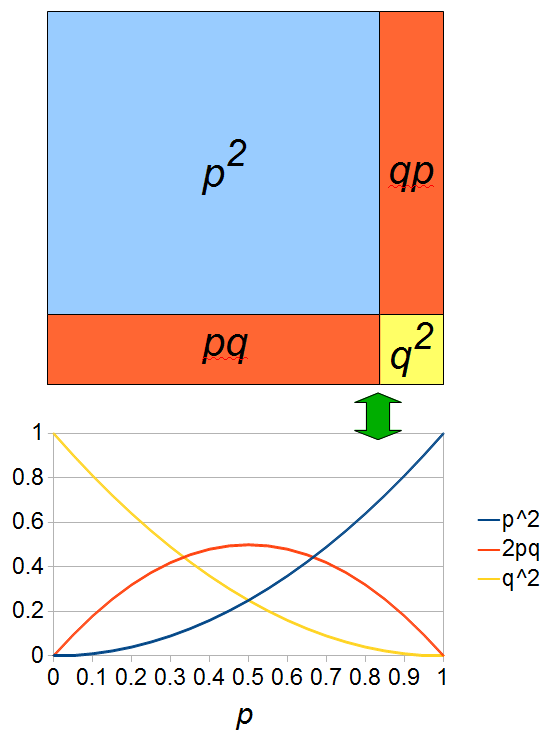
Everything in genetics starts with mutations, but once we have mutations to study, work with and think about, what follows? One direction is thinking about the dynamics of these gene differences (alleles) in large populations over time. In 1922 R. A. Fisher compared this to the study of gases in physics. The trajectories of the individual molecules are too complex to keep track of individually, but when a large number are considered as a group, individual differences average out and certain measurable and predictable properties arise like the relationship between temperature, pressure and volume. (The kinetic theory of gases and the ideal gas law.)
An allele is at some frequency in a population. The frequency has to be a fraction between zero and one (or equal to zero or one). We can keep track of the frequency with  . For example, if the allele is at 50% frequency we can write
  . Most species we think about are diploids and have two copies of most genes. For simplicity let's say there are only two alleles in a population (
 and
and  , for the moment we are not worrying about which one might be designated a mutant or wildtype) and that the population is very large, so that all possible combinations are present no matter how rare. Let's also say
  is the frequency of the
  allele. If we pick a diploid individual in the population and pick one gene copy, what is the probability it is an
  allele? The probability is simply the frequency of the allele in the population, which is equal to
  ;
;  .
.
A related question is, what is the probability that both alleles found in an individual are  ? The simplest assumption is that choosing the two alleles is independent; i.e. if one allele is an
  this doesn't affect the probability that the second allele is or is not an
  . So we are asking what is the probability the first allele is
  and the second allele is
  . This is the logical intersect
  . One way to think about this is that within the group where the first allele is
  , which is a frequency of
  , the fraction that has a second allele of
  is also
  .
.  had to be drawn twice and the chance of this is
  for the first copy and
  within that fraction for the second copy:
  .
.  is also the expected frequency of
  homozygotes (two copies of the same allele) in the population (probabilities and frequencies work both ways).
What about the frequency of the  allele? Since we are only dealing with two alleles in the population, and the result of all possible outcomes must sum to one, 100%, the frequency/probability of the second allele is the probability it is not the first allele,
  . (I like to use the
  symbol for not because other not symbols can be ambiguous in general contexts.) So the probability of drawing two
  alleles is
  .
.
This introduces the "and" and "not" rules in probability. If events are independent, this and that, the probability of the combined outcome is found by multiplying the frequency of the individual events. If we are talking about the opposite of an event, not that but everything else, the probability (complement) is found by subtracting from 1 (100%). There is also an "or" rule that comes up quite frequently and that we will use next. If two events are mutually exclusive, this or that occurred, then the combined probability is found by adding the two individual probabilities together.
So, what is the frequency of heterozygotes, where individuals have one of each allele,  and
and  . Based on what I wrote above you might at first think we should multiply the allele frequencies together,
  , after all, if choosing the alleles is independent then the first one does not affect the choice of the second. This is right but not completely right. The trick that comes up here is that there are two ways to be a heterozygote. The first allele chosen could be an
  and the second allele an
  or vice versa, the first allele was an
  and the second an
  . This may seem arbitrary; however, a natural way to keep track of the two outcomes to visualize this is the keep track of which allele comes from which parent. The
  could have come from an organisms father and
  from the mother, or
  was from the father and
  from the mother. These two events are mutually exclusive, either one happened or the other (they are not independent, if you are a heterozygote then getting an
  from your mother means the
  allele had to have come from your father). In set theory this is the logical union,
  , of the two outcomes (and we are keeping track of the order of events),
  . This is calculated by adding the two mutually exclusive outcomes together,
  .
.
Just for fun, let's substitute in all the logic symbols.


Then substitute in standard arithmetic symbols and  for the probability of
  .
.

 is equal to
  so these can be added together by multiplying one by two.

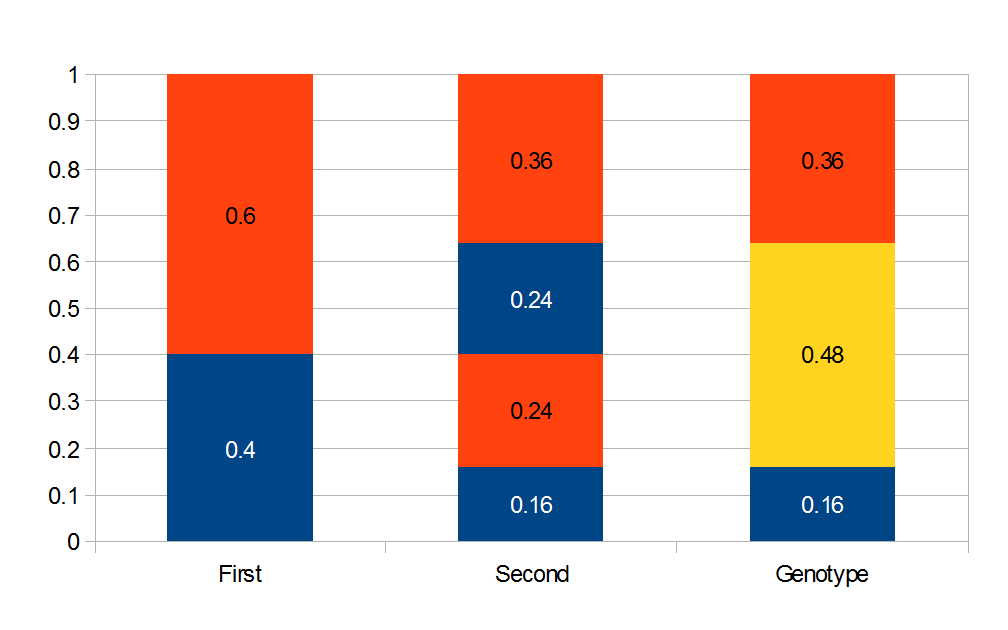
Above is a plot to illustrate. If  then the probability of drawing the corresponding allele first is
  , (blue in the "First" bar above). Within that class of 40% the probability of drawing the same allele again is 40% of 40% or 16% ("Second" allele above). The two types of heterozygotes can be combined (yellow in the "Genotype" bar). So if
  is the frequency of
  alleles then we expect 16%
  homozygotes, 48%
  heterozygotes, and 36%
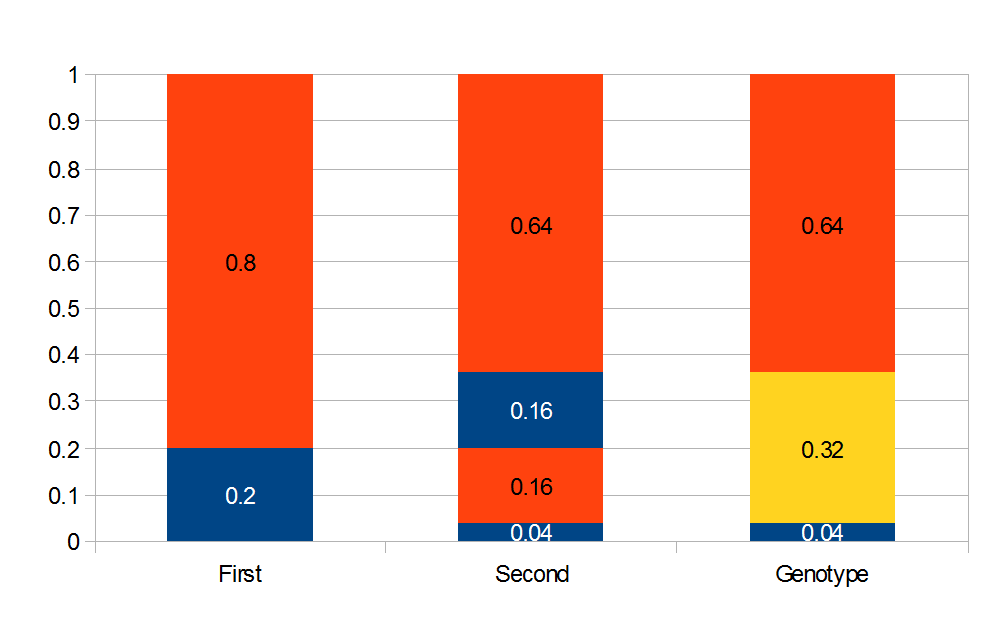
  homozygotes. Here is another plot with
  .
.
As an allele becomes rare its corresponding homozygote becomes very rare. Also, rare alleles are most often found in heterozygote form (which makes sense, if you are rare you are most often paired with something else).
OK, so now we have all possible outcomes. If  is the frequency of the
  allele (and there are only two alleles in the population), the frequency of
  homozygotes is expected to be
  ; the frequency of
  ,
,  heterozygotes is
  ; and the frequency of
  homozygotes is
  . You may still be suspicious about multiplying the heterozygotes by two, so to check this mathematically the frequency of all possible outcomes must sum to one, if we have done everything correctly (although this doesn't prove we are correct, there are ways to make mistakes that also sum to one, but if it does not sum to one it proves that this is incorrect). First of all the allele
  and
and  must equal one when added together. It is easy to see that
  cancels out, so
  . Adding the genotype frequencies gives
  ; this can be factored to
  . As we just saw,
  . So
. So  and
and  .
.
If we had not multiplied by two in the heterozygote term we would have had

This is not equal to one (except for the special case where  is zero), so not multiplying the heterozygote term by two is incorrect. Also, notice that we end up with one minus half of the heterozygotes (
 ), which also makes sense, half of the heterozygotes are missing by not multiplying
  by two.
Also, we can see that the genotype frequencies  are the binomial expansion of
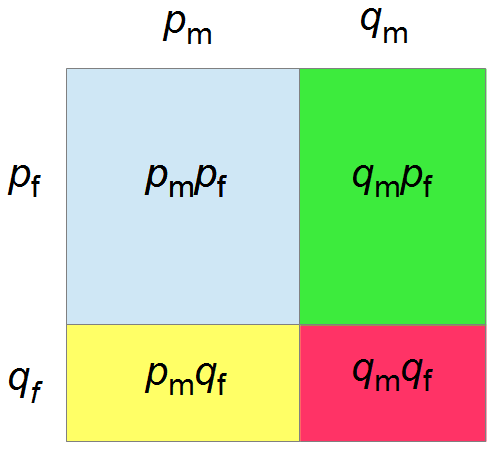
  , which is another way of saying that we are combining alleles in pairs (from the allele frequencies in the fathers and mothers in the population). To illustrate this lets make the
  frequency equal to
  to save space (
 ).
).
If we let the sides of this square represent parental allele frequencies and an "m" subscript represents the allele frequencies in males while "f" represents females, then the areas inside the square give the relative proportions of offspring genotypes. (Notice there are two types of heterozygotes but only one way to get each homozygote.) It is often assumed that allele frequencies are equal between males and females but this does not have to be the case. In the plot above  .
.
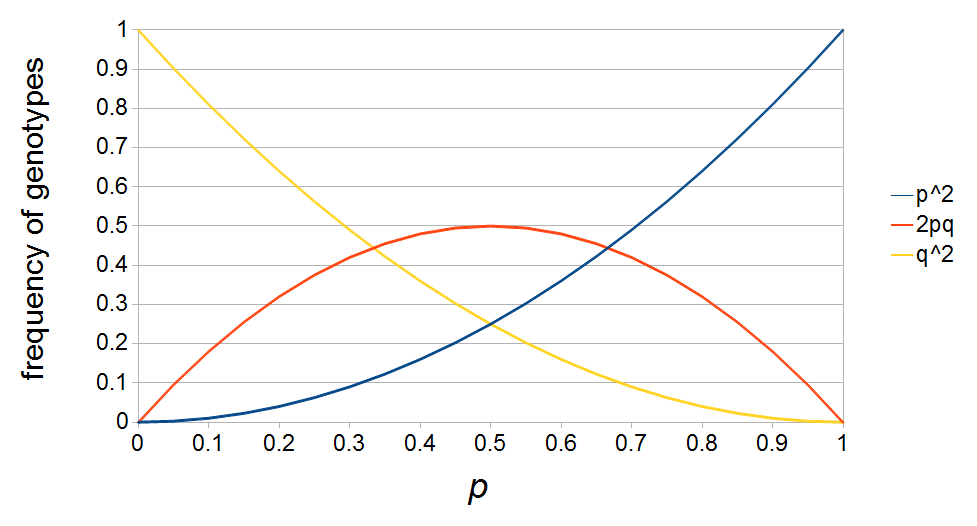
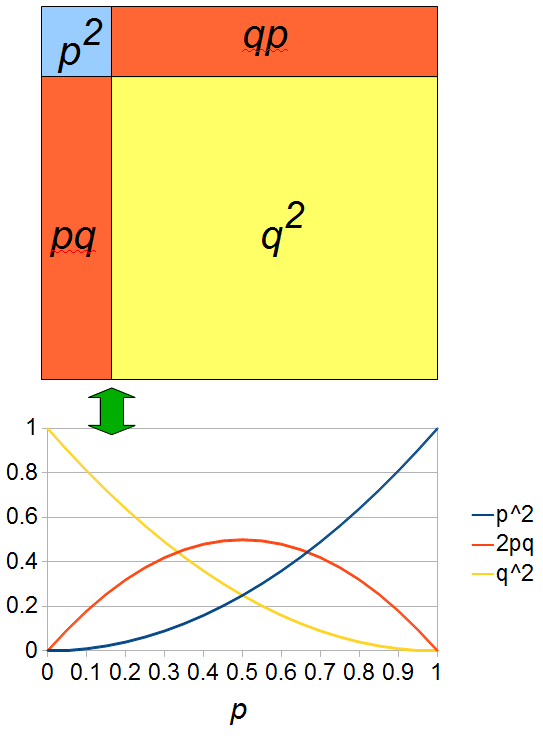
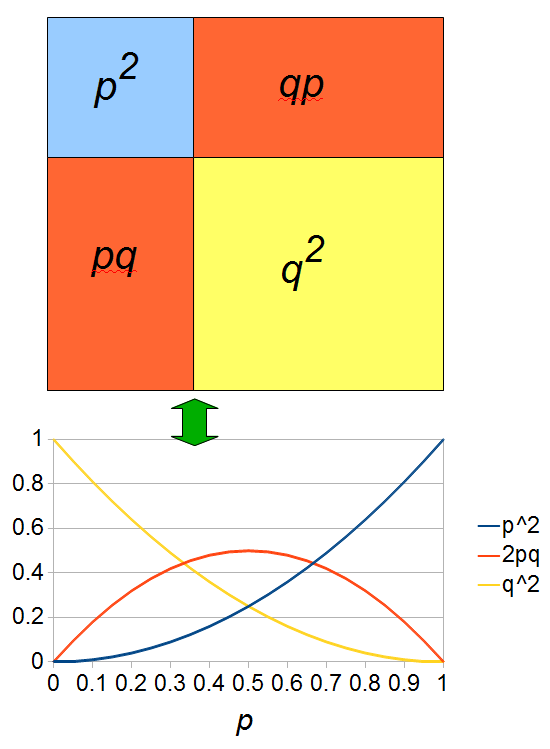
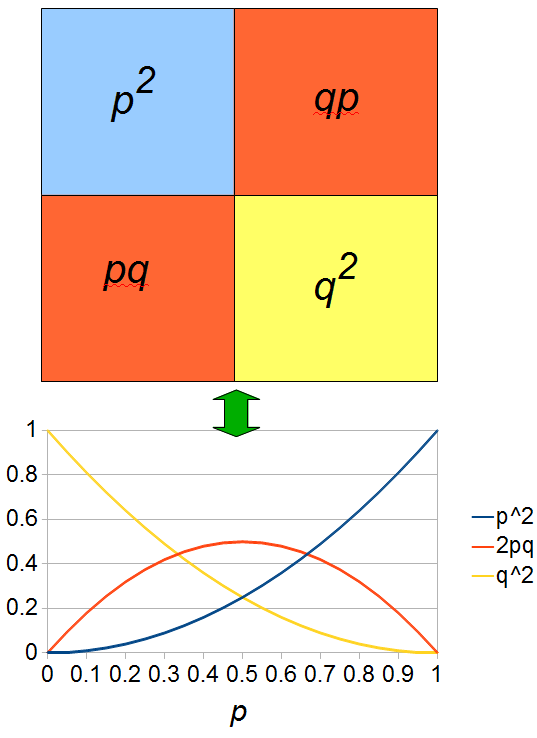
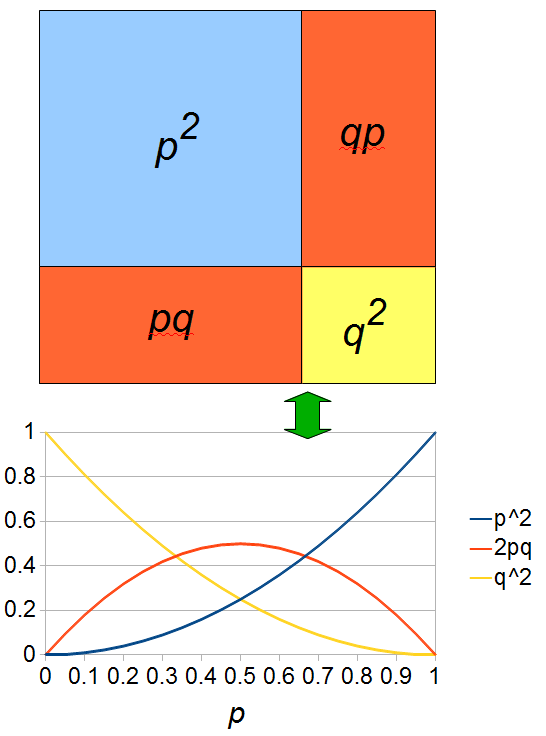
The plot above gives the relative genotype frequencies expected as a function of  . At each point on this we can plot the corresponding square as in the plots below.
So, what can we do with this? Well, for example, in the EU approximately 1 out of 2,500 people (link) are born with cystic fibrosis (CF) which can cause, among other complications, life-threatening lung infections in affected individuals. CF is caused by recessive alleles at a single gene, CFTR. We can infer that these affected individuals are homozygotes and have two copies of the allele(s) that result in CF. What fraction of people in the EU are carriers and have one copy of the disease causing allele but are unaffected because it is recessive? Well, assuming Hardy-Weinberg genotype frequencies, we can set  . Taking the square root gives an allele frequency of
  . Using this frequency estimate the fraction of heterozygote carriers in the population is
  . (As a rule of thumb, the frequency of carriers of rare alleles is about twice the allele frequency.) In other words about four percent, or one out of 25 people in the EU, are expected to be carriers of an allele that results in CF when homozygous--a surprisingly high number.
