Monthly Archives: March 2013

The Mitochondrial Genome

Dmel-mtDNA-genome

Above is a map of the mitochondrial genome of the fruitfly, Drosophila melanogaster.  One fun thing about the mtDNA genome is that it forms a loop instead of a linear sequence like the rest of our chromosomes (humans have them too).  It is very small compared to the rest of the genome; the D. melanogaster one is under 20,000 bp (basepairs).  In most, but by no means all, animals the mitochondria is inherited from the mother.  Its job in the cell is to produce chemical energy for the cell (in the form of ATP).  In blue, in the image above, there is an origin of replication used to copy and divide the genome into daughter mitochondria.  In yellow are genes that carry out various functions.  In purple and red are RNAs for producing the proteins coded for by the genes.  The section I have been sequencing from various species and talking about in the last couple posts is indicated at 1 o'clock (upper right) in dark purple by "BLAST Hit," which is in cytochrome c oxidase subunit I (COI).

Three insect species COI alignment

We also extracted DNA from some fruit-flies (Drosophila melanogaster) we had in the lab and from some mosquito larvae we found on campus in a stagnant pool.

IMG_0135

The stone "coin" had a lot of mosquito larvae in the pool of rainwater in its center.

IMG_0141

In the image above you can see larvae floating in rainwater above cigarette butts.

We sequenced COI from these as well.  Based on the sequence the mosquito larvae turned out to be Culex quinquefasciatus (the southern house mosquito which was unintentionally introduced to Hawai'i in the 1800's).

3insect-COI-alignment

In the image above I have made an alignment of the sequences from the three species (including the mantis, Tenodera sinensis, from the last post).  Base-pairs that are different from the other two are highlighted.  Toward the end of the Culex sequence are some N's.  These are just positions where the sequence was difficult to determine and has some uncertainty, not necessarily an actual difference.  In the rest of the sequence there are four patterns: positions in which Culex is different, positions in which Drosophila is different, positions in which Tenodera is different, and positions in which all three are different from each other.  I've put the counts of these together below.

Culex: 52
Drosophila: 38
Tenodera: 82
All three: 8

So, based on these DNA sequences, we can see that Culex mosquitoes and Drosophila fruitflies are more similar to each other than either is to the Tenodera mantis.  This makes sense in terms of insect classification.  Mosquitoes and fruit-flies are both in the order Diptera (flies) and both have two wings (which is what di-ptera means).  Mantises are in the order Mantodea and incidentally, like most winged insects, have four wings.

The relative distances of these DNA sequences can be illustrated by the "tree" below.

3insect-COI-tree

(These types of graphs are called trees.)  The branch from the center to the mantis (T. sinensis) is the longest because it has the most differences from the other two.  The branch to C. quinquefasciatus is a bit longer than the one to D. melanogaster because the mosquito has more DNA differences unique to it than the fruitfly.  This is a simple example of how biologists can build trees to illustrate the relationship between organisms.

Mantis DNA sequence

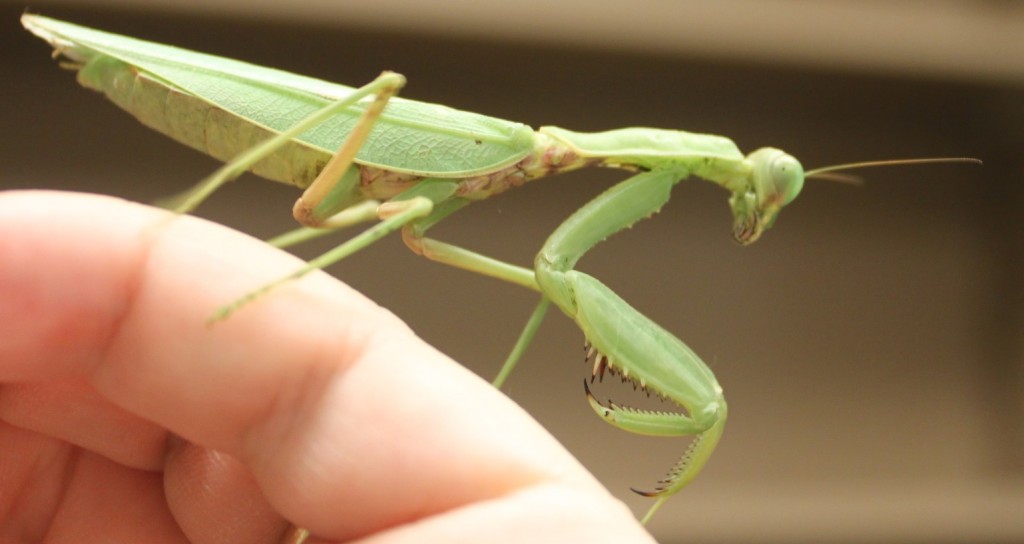
I've been brushing up on DNA extraction, PCR (DNA amplification) and prepping the product for DNA sequencing (Sanger sequencing).  The sequencing is done at a site on campus (link).  We submitted our first DNAs Friday afternoon and got the results back by email Saturday afternoon!  We tested a range of samples with a range of primers to see what worked and what didn't.  (Part of this is getting ready for a genetics class I am teaching in the fall where I want students to sequence DNA from biological samples they collect.)  My daughter found a praying mantis (Tenodera sinensis) in a parking lot so I snipped off a tiny piece of the end of one of its feet for a DNA sample.

D7-mantis-organism

After DNA extraction I used two primers (short nucleotide sequences) to target a section of DNA, 710 base-pairs long (DNA letters), for amplification.  (The primers are "LCO1490" 5'-GGTCAACAAATCATAAAGATATTGG-3' and "HCO2198" 5'-TAAACTTCAGGGTGACCAAAAAATCA-3', Folmer et al. 1994)  The PCR worked!  There was a band on the gel the right size. Below is an image of the DNA.

D7-COI-gel-image

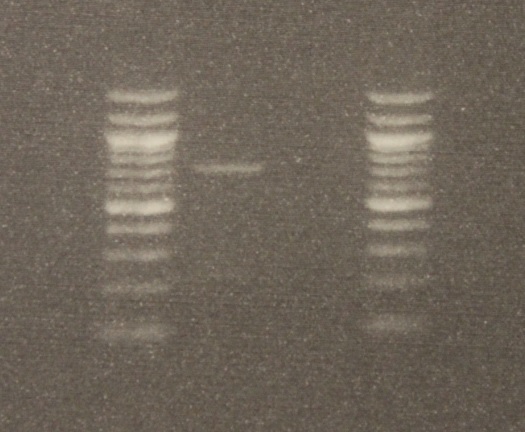
The gel image is read bottom up in columns.  The first and last columns on the right and left with all the bright bands are DNA "ladders."  Those are a collection of different sized DNAs to use as a reference.  The bottom of the gel is positively charged and the top negative when it is running (before taking the image).  This is done by hooking it up to 90 volts for half an hour.  DNA is negatively charged so it runs down the gel.  Smaller segments run faster than large ones so it separates a mixture by size.  The PCR from the mantis sample is in the second row and a blank sample containing no DNA is beside it in the third row (this is a negative control for possible DNA contamination).  By comparing the band from the mantis sample to the ladder we can see that a sequence between 700 to 800 base-pairs was amplified.

The sequences from this PCR amplification came back very nice with high quality signal.  Here is a screen capture showing part of the "trace" file.

D7-mantis-COI

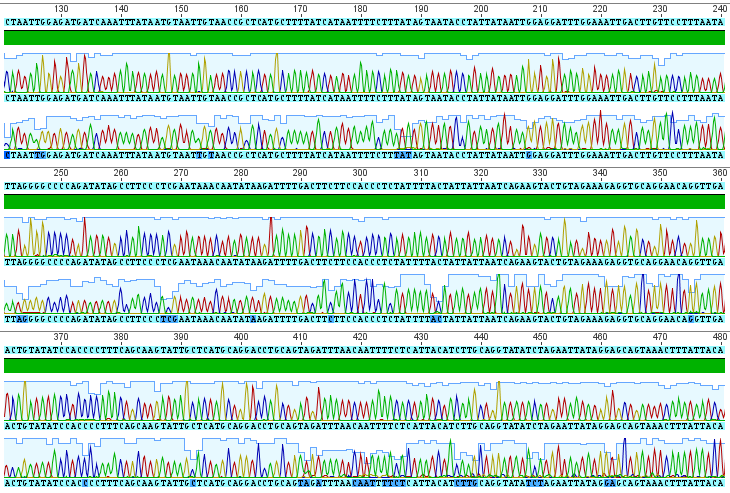
Each peak corresponds to a signal from a base-pair at that site along the DNA sequence (red=A, blue=C, yellow=G, green=T).  There are two rows at each site because I sequenced both strands.  The region I amplified is a small part of the cells mitochondrial genome, in a gene called COI for short (Cytochrome c Oxidase subunit I).  From the results I get the following, cleaned up, 684 basepair DNA sequence (in fasta format).

>Mantis_COI
CATAAAGATATTGGAACACTATATTTTATTTTTGGTGCATGAGCAGGTATATTAGGAACATCTTTAAG
AATTCTAATTCGAACCGAATTAGGTCAACCAGGTTCCCTAATTGGAGATGATCAAATTTATAATGTAA
TTGTAACCGCTCATGCTTTTATCATAATTTTCTTTATAGTAATACCTATTATAATTGGAGGATTTGGAA
ATTGACTTGTTCCTTTAATATTAGGGGCCCCAGATATAGCCTTCCCTCGAATAAACAATATAAGATTT
TGACTTCTTCCACCCTCTATTTTACTATTATTAATCAGAAGTACTGTAGAAAGAGGTGCAGGAACAG
GTTGAACTGTATATCCACCCCTTTCAGCAAGTATTGCTCATGCAGGACCTGCAGTAGATTTAACAAT
TTTCTCATTACATCTTGCAGGTATATCTAGAATTATAGGAGCAGTAAACTTTATTACAACTATAATTAAT
ATAAAACCATTATATATAAATCAAACTCAAGTTCCCCTTTTTGTTTGATCCGTTGGTATTACAGCTTTA
TTACTTCTATTATCATTACCTGTTCTTGCAGGAGCAATTACTATATTATTAACTGATCGAAATCTAAATA
CCTCATTTTTTGATCCTGCTGGAGGAGGTGATCCTATTCTTTATCAACACTTATTTTGATTTTTTGGT

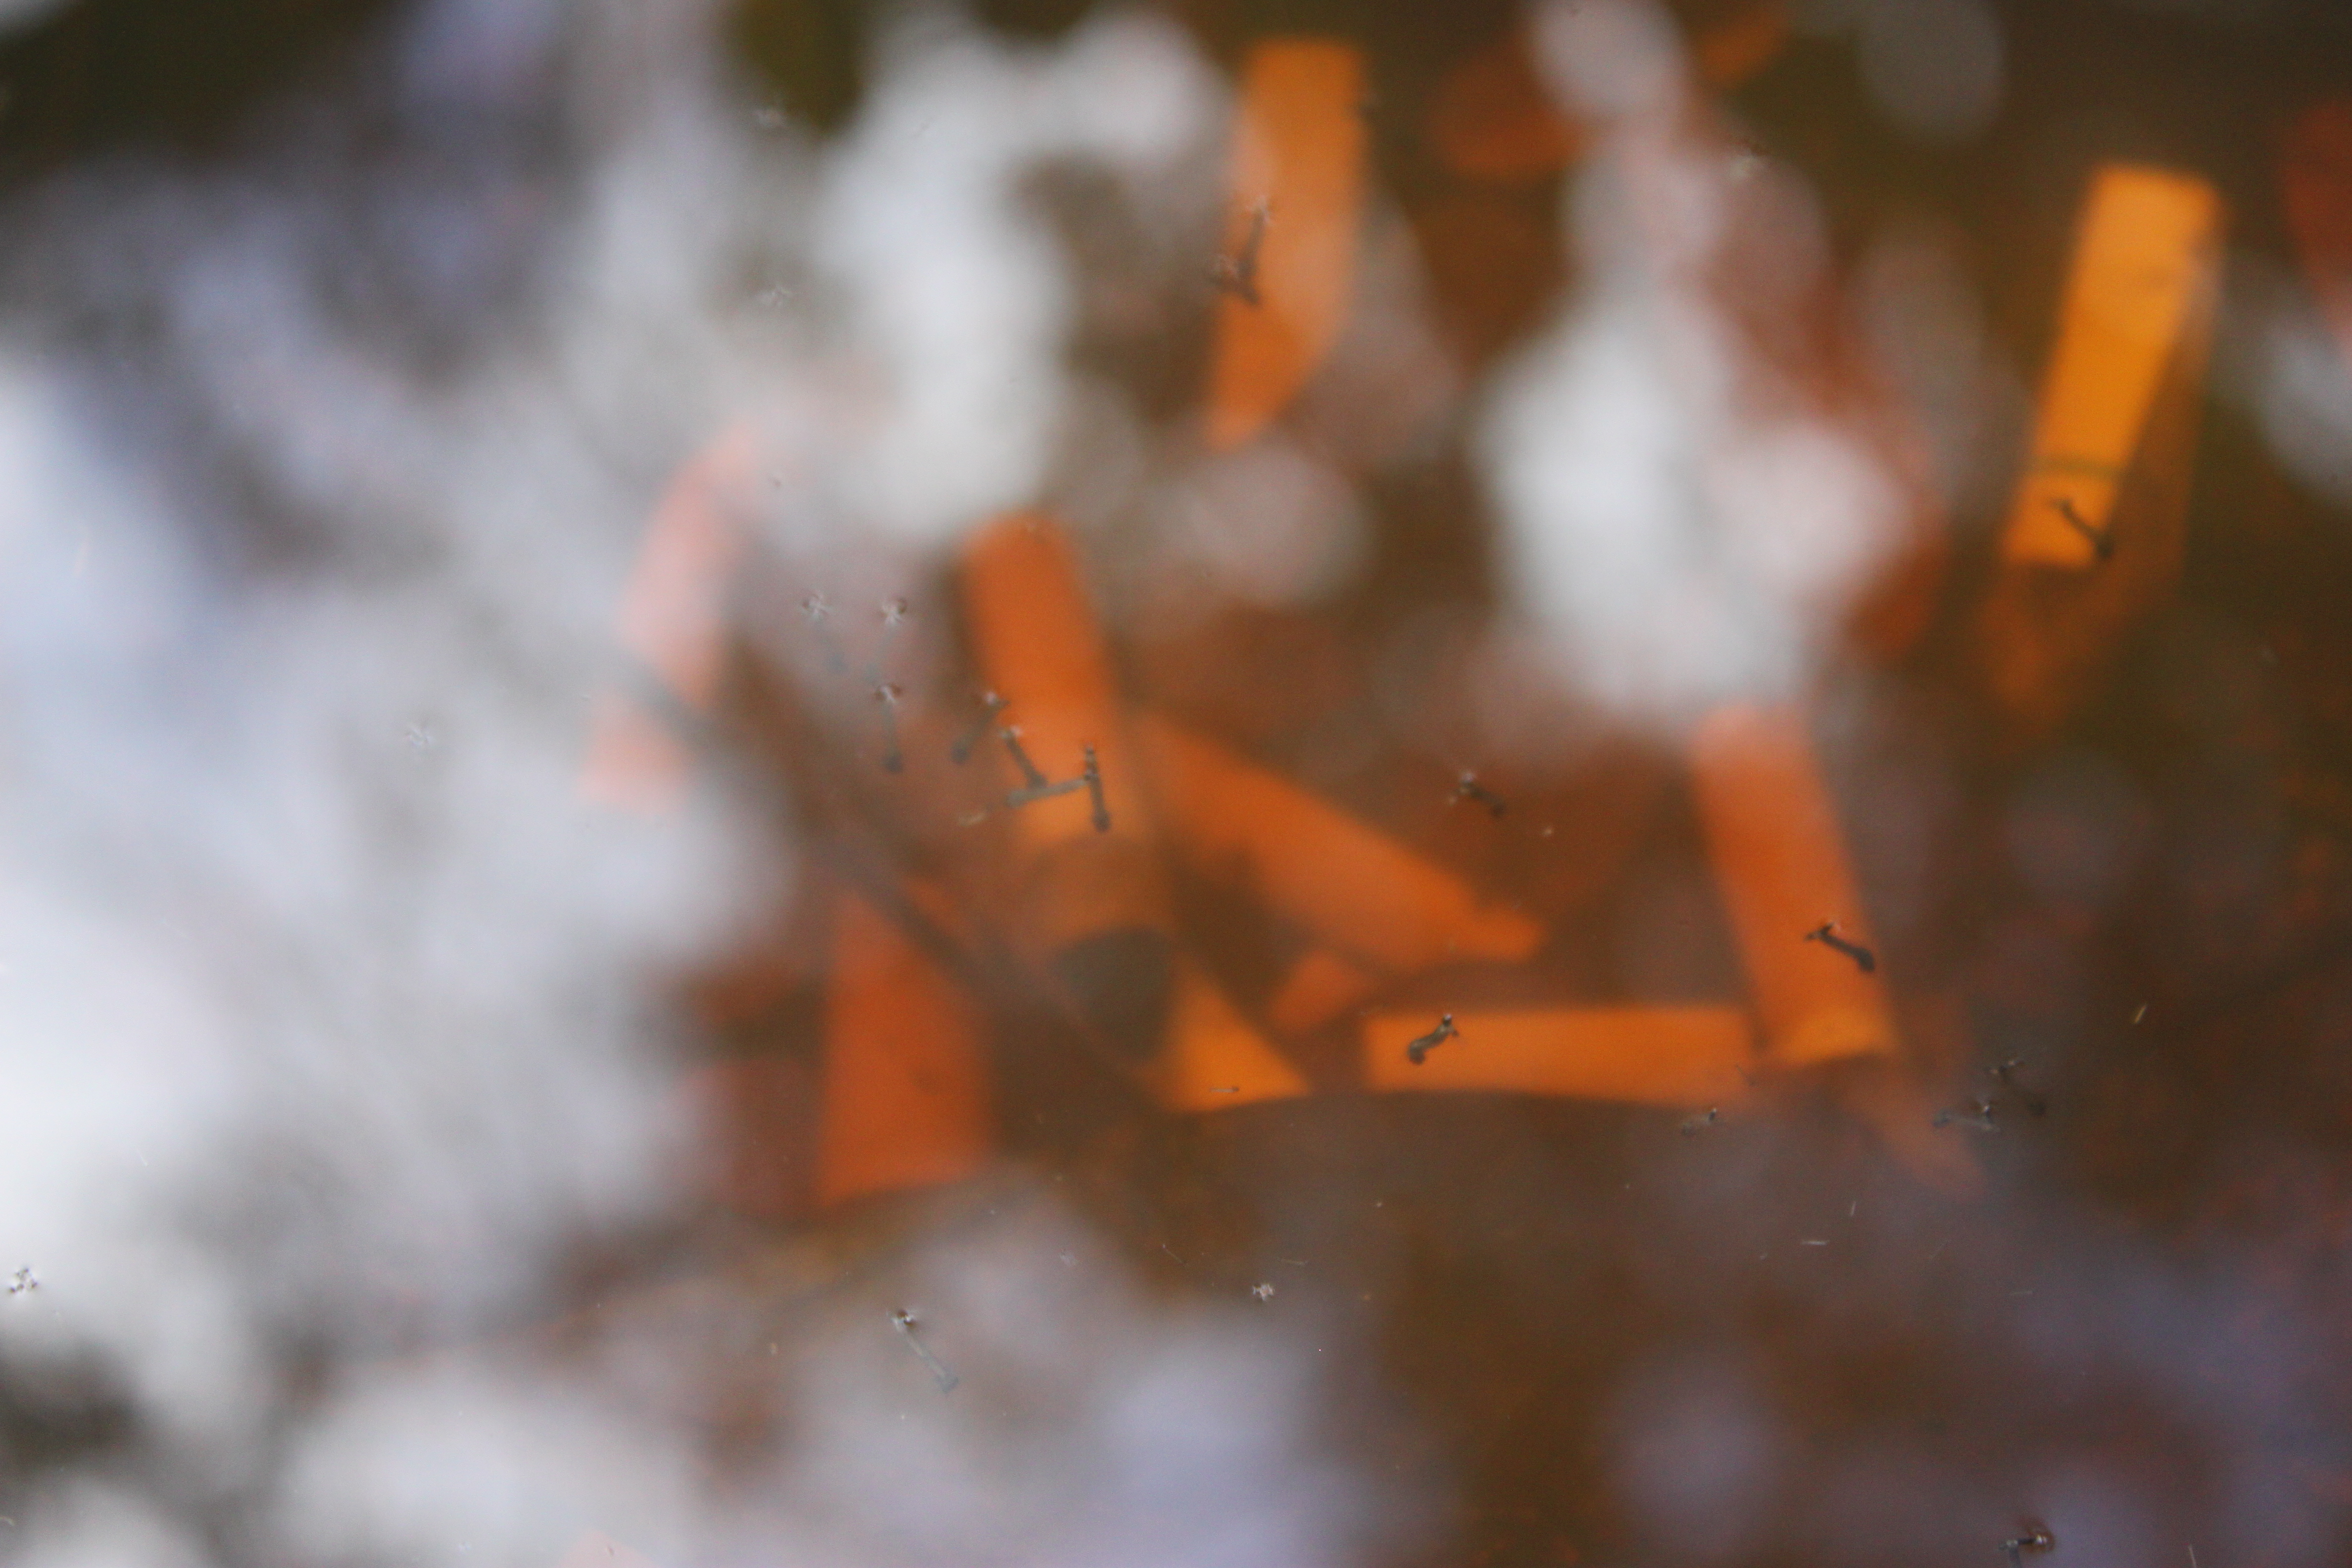
Just to check if this is the right sequence (I might have accidentally switched samples or there is always a possibility of DNA contamination) I searched for similar sequences using BLASTn on GenBank.  Here is a screen shot of the most similar sequences.

mantis-blast-result

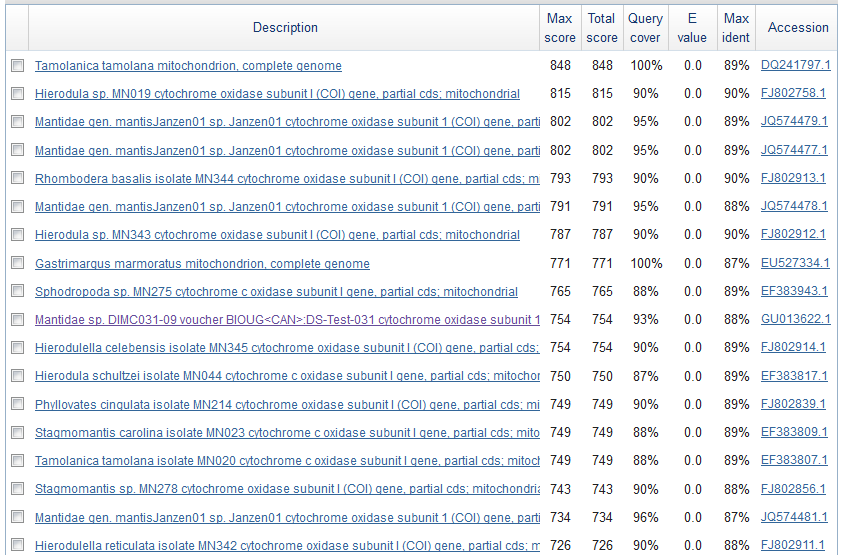
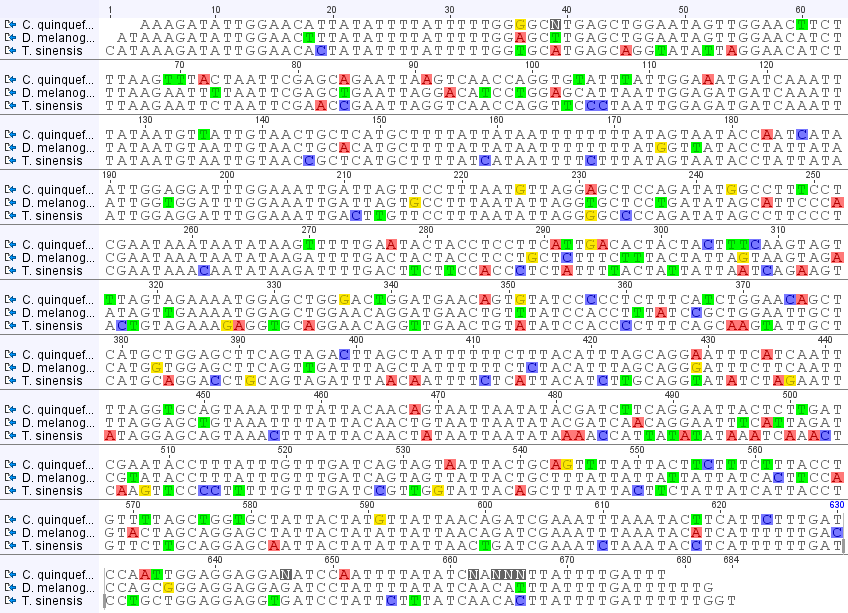
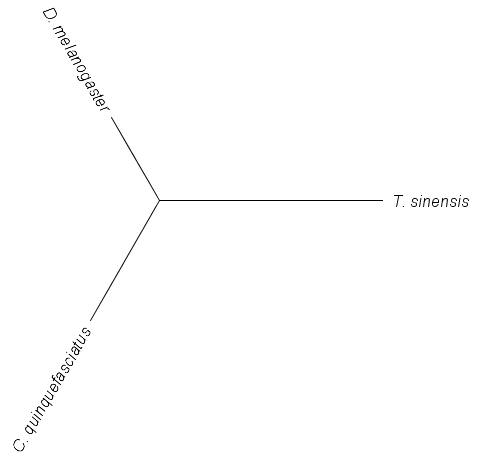
These are Mantis (Mantidae family) species that are returned so this looks correct.  The top match is compared below.

mantis-top-match

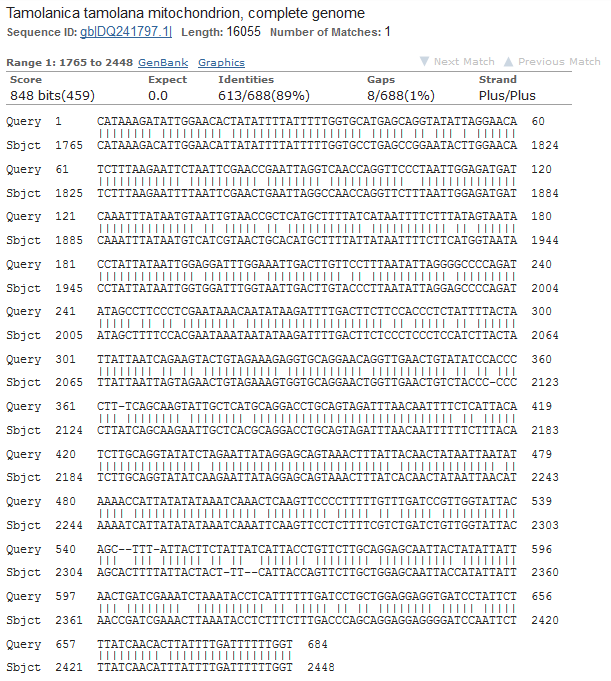
Tamolanica tamolana, the shield mantis from New Guinea, is 89% identical.

Visualizing Underdominance

A followup from the last post.  I have used Mathematica to create an animation of the effect of changing genotype fitness values.  There is a lot of background information I am skipping over at the moment--I plan to put together a separate page to go through this in more detail.  However, for now, In short, if you have two alleles (alleles are types of a gene) in a population, you can have homozygotes (individuals that have two copies of the same allele) or heterozygotes (individuals that have a copy of each type of allele).  So two alleles (A and a) result in three genotypes (AA, Aa, and aa).  In this example AA and aa are the two homozygotes and Aa is the heterozygote.  These genotypes can have different fitnesses which affect how many descendants organisms have in future generations.

Underdominance Illustration

In the illustration above, on the right is a plot of genotype fitnesses.  Underdominance is the case where heterozygotes (Aa, green bar) have a lower fitness than either homozygote (AA, purple, aa, red).  On the left is a plot of the predicted change in allele frequencies over 10 generations (x-axis) from a range of starting frequencies (y-axis).  If the "a" allele starts at a low frequency it declines and is lost in the population.  However, if it starts at a high enough frequency it can actually increase to 100% over the next few generations.  (The population ends up as all "aa" homozygotes, despite the fact that they have a substatially lower fitness than "AA" homozygotes!)  The boundary between these two regions (where the "a" allele increases or decreases) is indicated by the dashed line.

I've made an animation (that runs too fast, but I don't know how to slow down the frame rate yet) that shows the change in trajectories over a range of fitness values.  I will put a link to it here

Underdominance Animation (click to see)

and, at least for the time being, it is uploaded to the index page of this site.

This is still not interactive.  I am thinking of exploring using the Processing programing language next to see if this might be a way to fully implement this.

Animating Equations

One thing I've wanted to make available for years now is a user interactive way to illustrate evolutionary dynamics--specifically underdominance.  I have been using Mathematica for about six years now and tried exporting a video of a table of plots that sequentially increment a value.  This example is just of a sine wave, and it is not interactive, but it is a first step.

Sine Wave Animation (Click link to see animation.)

...and below is a screen capture of the Mathematica notebook to create the animation.

sine-animation-notebook

A Lab Blog

Hello World,

I am an assistant professor starting a new research group in the Department of Biology at the University of Hawai'i and wanted to start on online website for and about the group.  I want to do this for several reasons; to help us communicate with each other, to start an alternative and accessible record of projects, but most of all to let anyone out there that is interested see what we do and are up to.

Part of this is motivated by a perception I have run into "out there" that professors only teach classes--but this is only part of what we do.  First and foremost I am a scientist and I went into the profession to do research.

I am new to Hawai'i and this is an exciting place to be for anyone working in the biological sciences, especially in fields related to evolution.  Hawai'i is unique in several respects and is unparallelled in the potential research opportunities here.  One of my first jobs/projects (and one that will never be finished) is to learn more about the natural history of Hawai'i.