After my earlier post about the expected distribution of allele frequencies due to genetic drift in a population I wanted to use some data to provide an example of the frequency spectrum of alleles in humans.
I downloaded HAPMAP data from NCBI from here:
ftp://ftp.ncbi.nlm.nih.gov/hapmap/frequencies/latest_phaseIII_ncbi_b36/fwd_strand/non-redundant/
and plotted the results from 312,957 SNP genotypes along the 1st chromosome in a sample of Yoruba from Ibadan, Nigeria.
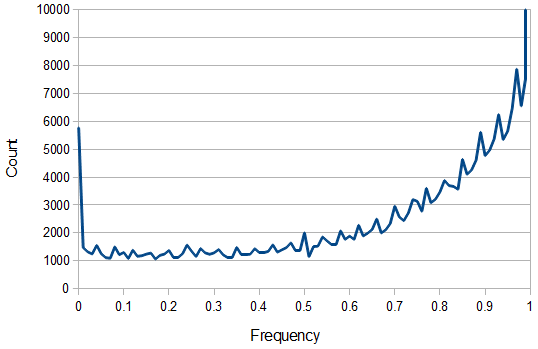
Above is a plot of the binned (1% bins) frequency of the reference allele. 5,769 SNPs had a reference allele frequency of zero and 73,603 were fixed at a frequency of 1 (these went off the scale of the plot).
Ignoring the sites that are not variable, from the earlier post we expect a U-shaped plot of polymorphisms. From the plot above you can see that it starts off fairly uniform but then climbs quickly after a frequency of 50%. This is one type of bias that has affected this dataset and is simply due to the fact that the most common allele tends to be chosen as the "reference" allele.
The data can be adjusted for this by averaging reciprocal allele frequencies ( and
and  ) making the plot symmetrical around 50%.
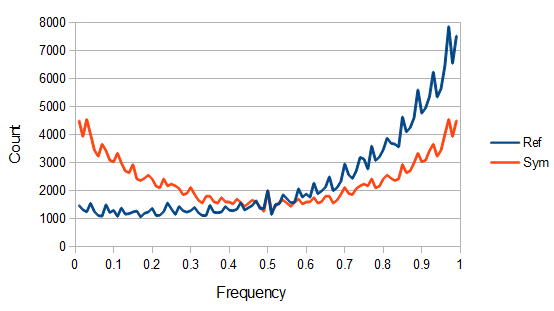
This transforms the blue curve into the red curve in the plot above and the data looks a little more U-shaped like we expect.
Now for the theoretical comparison. As I stated in the earlier post, it is not possible to normalize the predicted curve to an area of one under the curve, so I used a constant to fit the curve to the middle frequencies in the range of 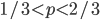 .
.
You can immediately see what is missing. The very low and very high allele frequencies are underrepresented in the actual data compared to their theoretical prediction.
Why? SNPs are typically discovered in a small sample and then genotyped in a larger sample. A small sample is less likely to contain variation for rare alleles. In the simplest case imagine genotyping a single person; they contain two chromosome copies and are likely to be heterozygous with a probability of  , which is 1/2 for
  but only 0.02 for
  .
.
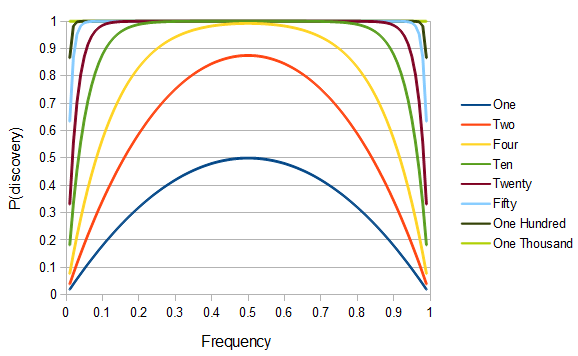
We can write down this probability. The probability of discovery of a SNP in a sample of  individuals is one minus the probability of not discovering it. To not discover the SNP the same allele would have to be sampled
  times (each person has two chromosomes copies). This could either be the allele with a frequency of or the alternate allele with a frequency of . So,
 ,
,
which gives the following plot for various sample sizes and allele frequencies:
In the previous plot of predicted and observed allele frequencies we can take the difference divided by the expected to find the fraction of SNPs missing due to sample size ascertainment bias.
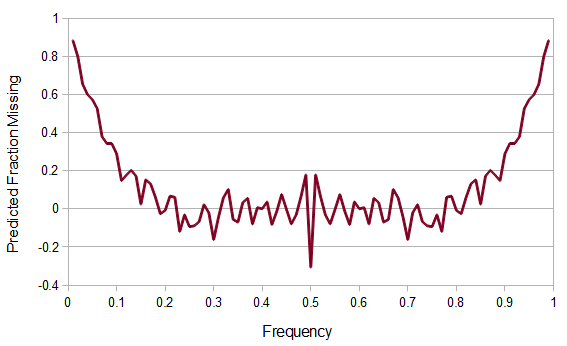
This climbs from over 25% missing at a frequency of  to over 50% missing at
  to over 80% missing SNPs at
  and less.
If we multiply the predicted allele frequency curve by the expected discovery curve (i.e., the SNP has to be discovered to be genotyped and included in the data and exists at a certain frequency), 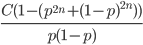 (where
  is a rescaling constant), and adjust the sample size to minimize the difference we end up with a nice match:
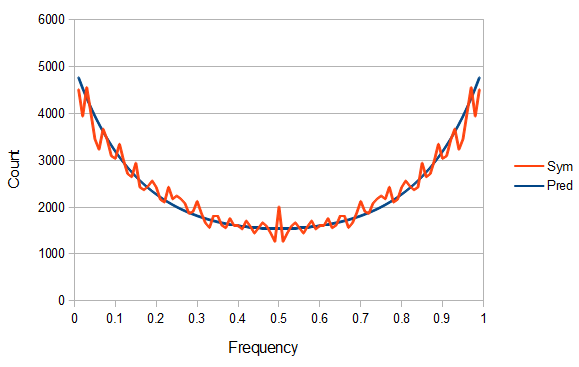
This fit curve indicates that effectively only about 13 chromosomes, or 6 1/2 individuals, were used as a sample to discover the SNPs.
Caveats: Of course discovery sample size varied across different SNPs and there are more sophisticated ways to estimate this distribution using maximum-likelihood but that is beyond what I want to mention here. There are other types of ascertainment bias that can affect the data, such as the SNPs being discovered in a population that is different from the one genotyped. Also, there are other forces that can skew the distribution, such as higher mutation rates and population size changes and other demographic dynamics, but these issues will be saved for later posts and the sample size effect addressed here is likely a large force in skewing the allele frequency distribution.