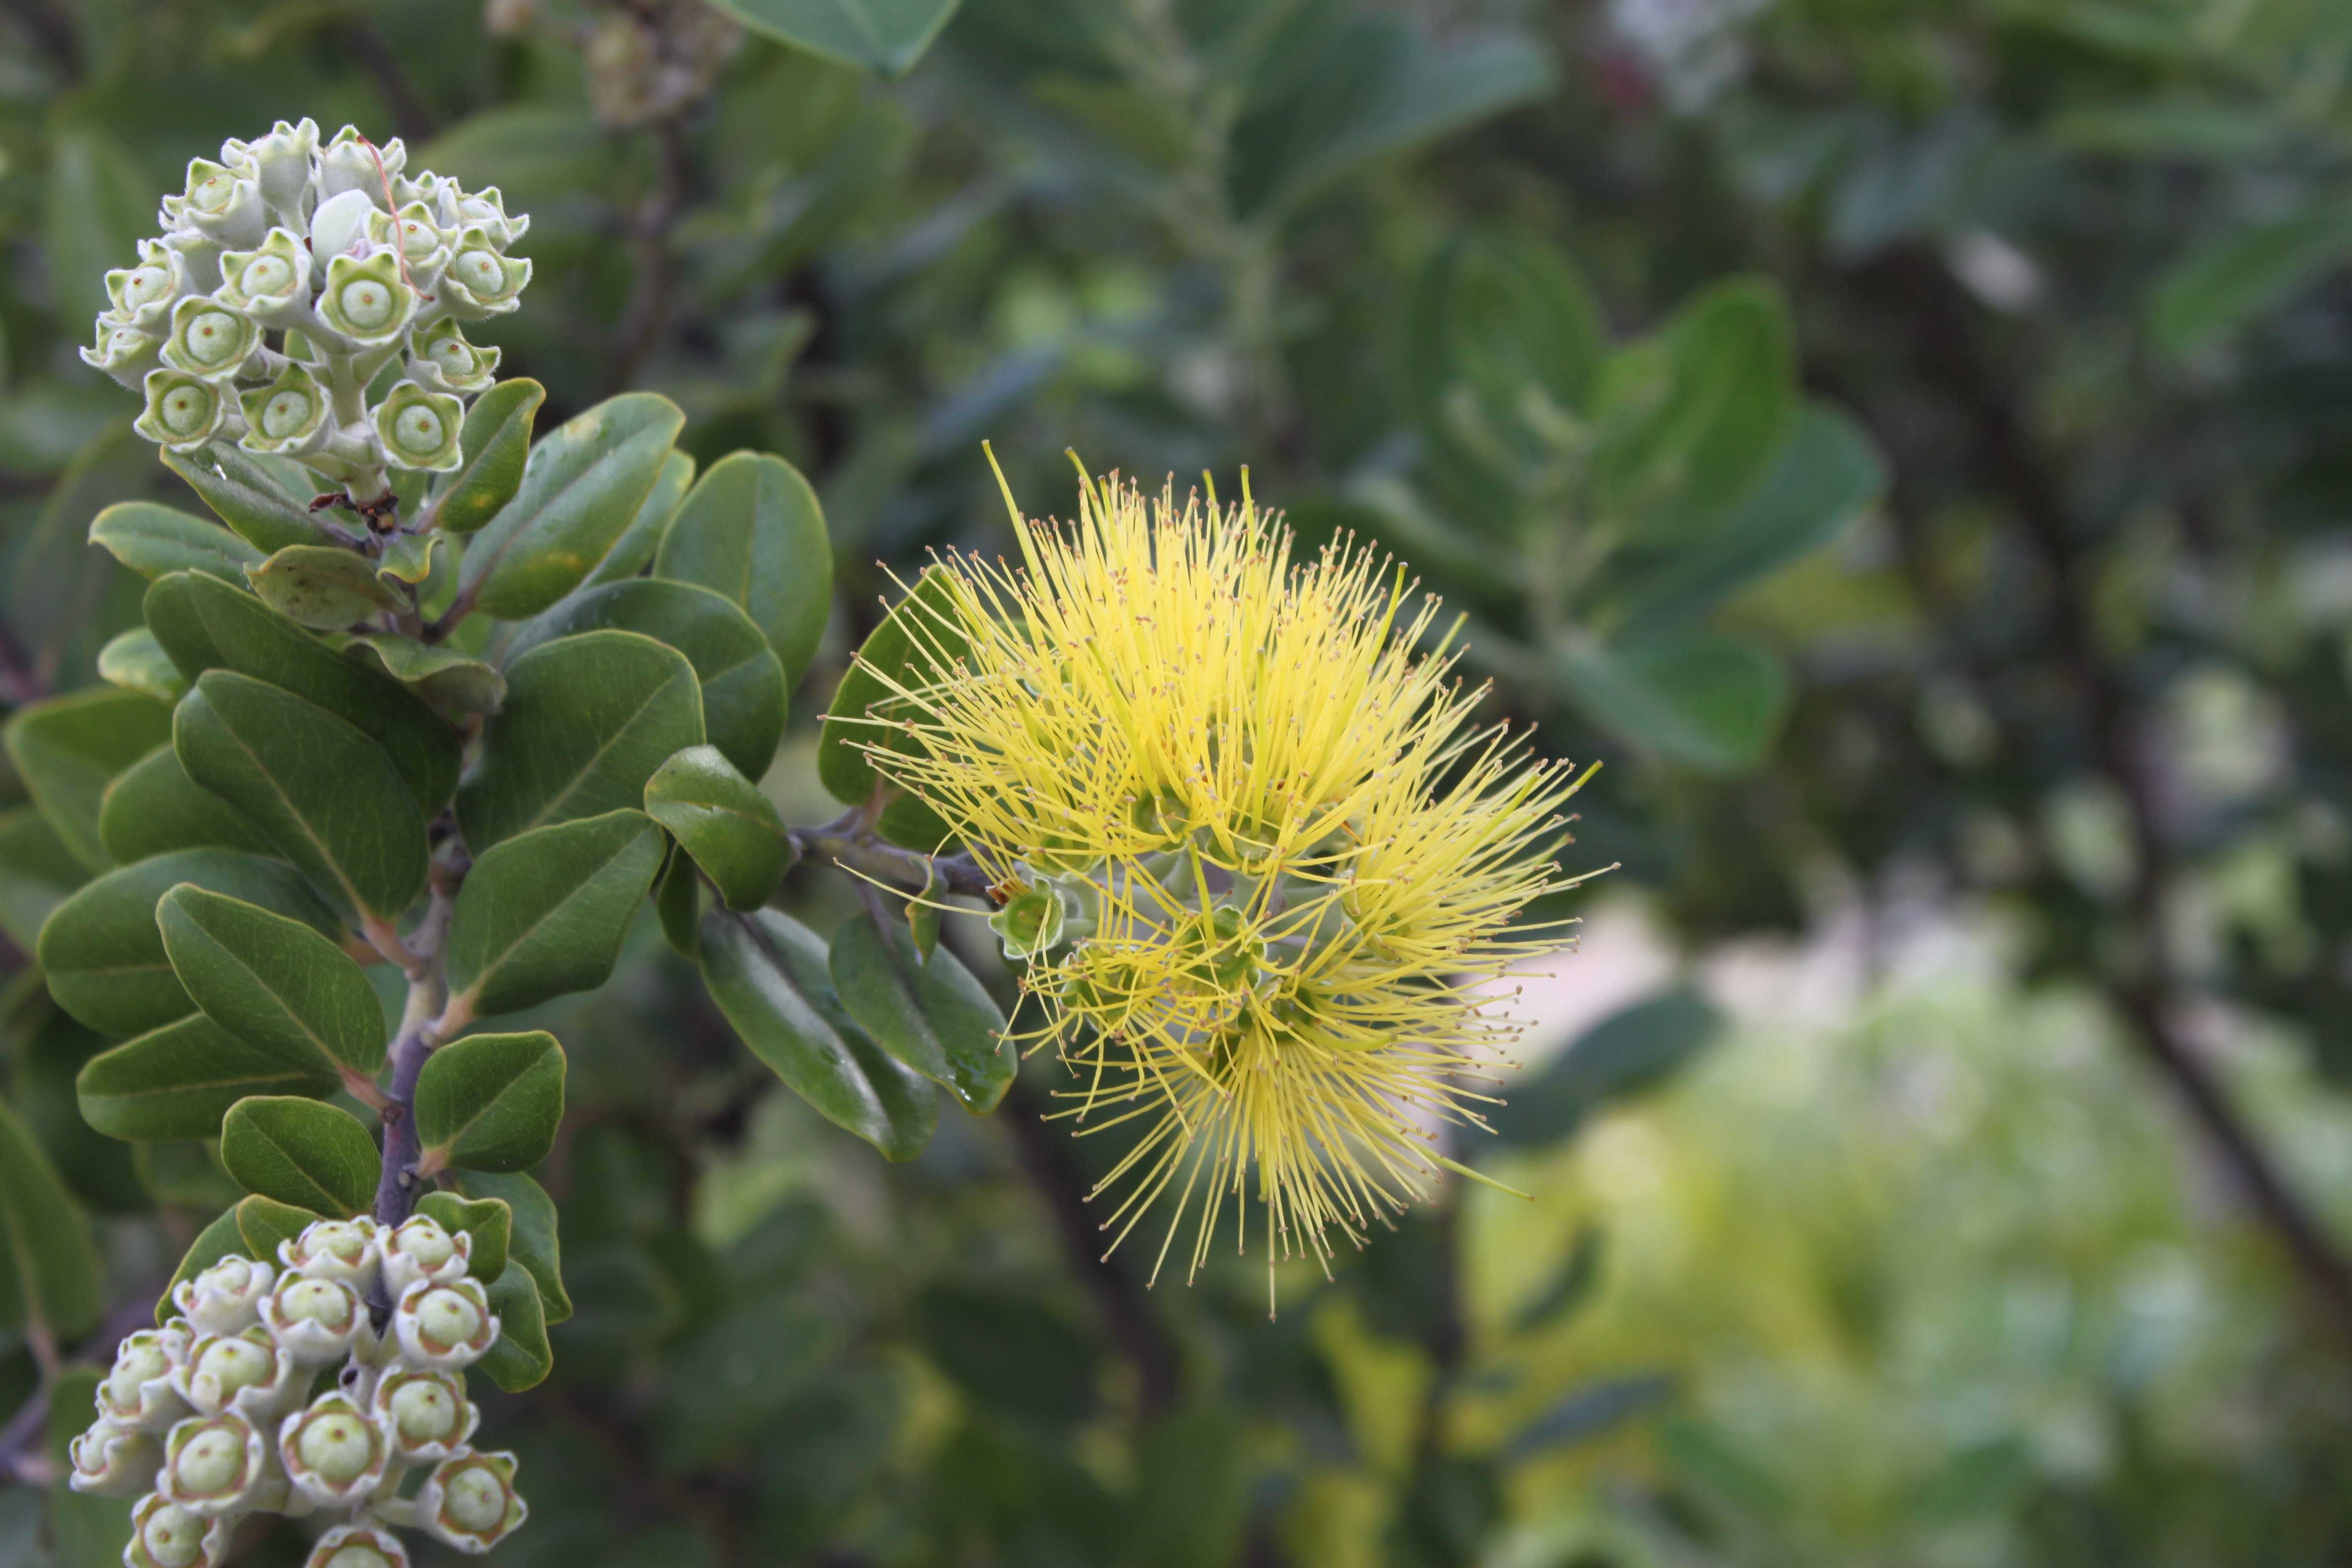
There are several interesting plants growing around the building where I work. One of these is the native ʻŌhiʻa lehua (Metrosideros polymorpha).
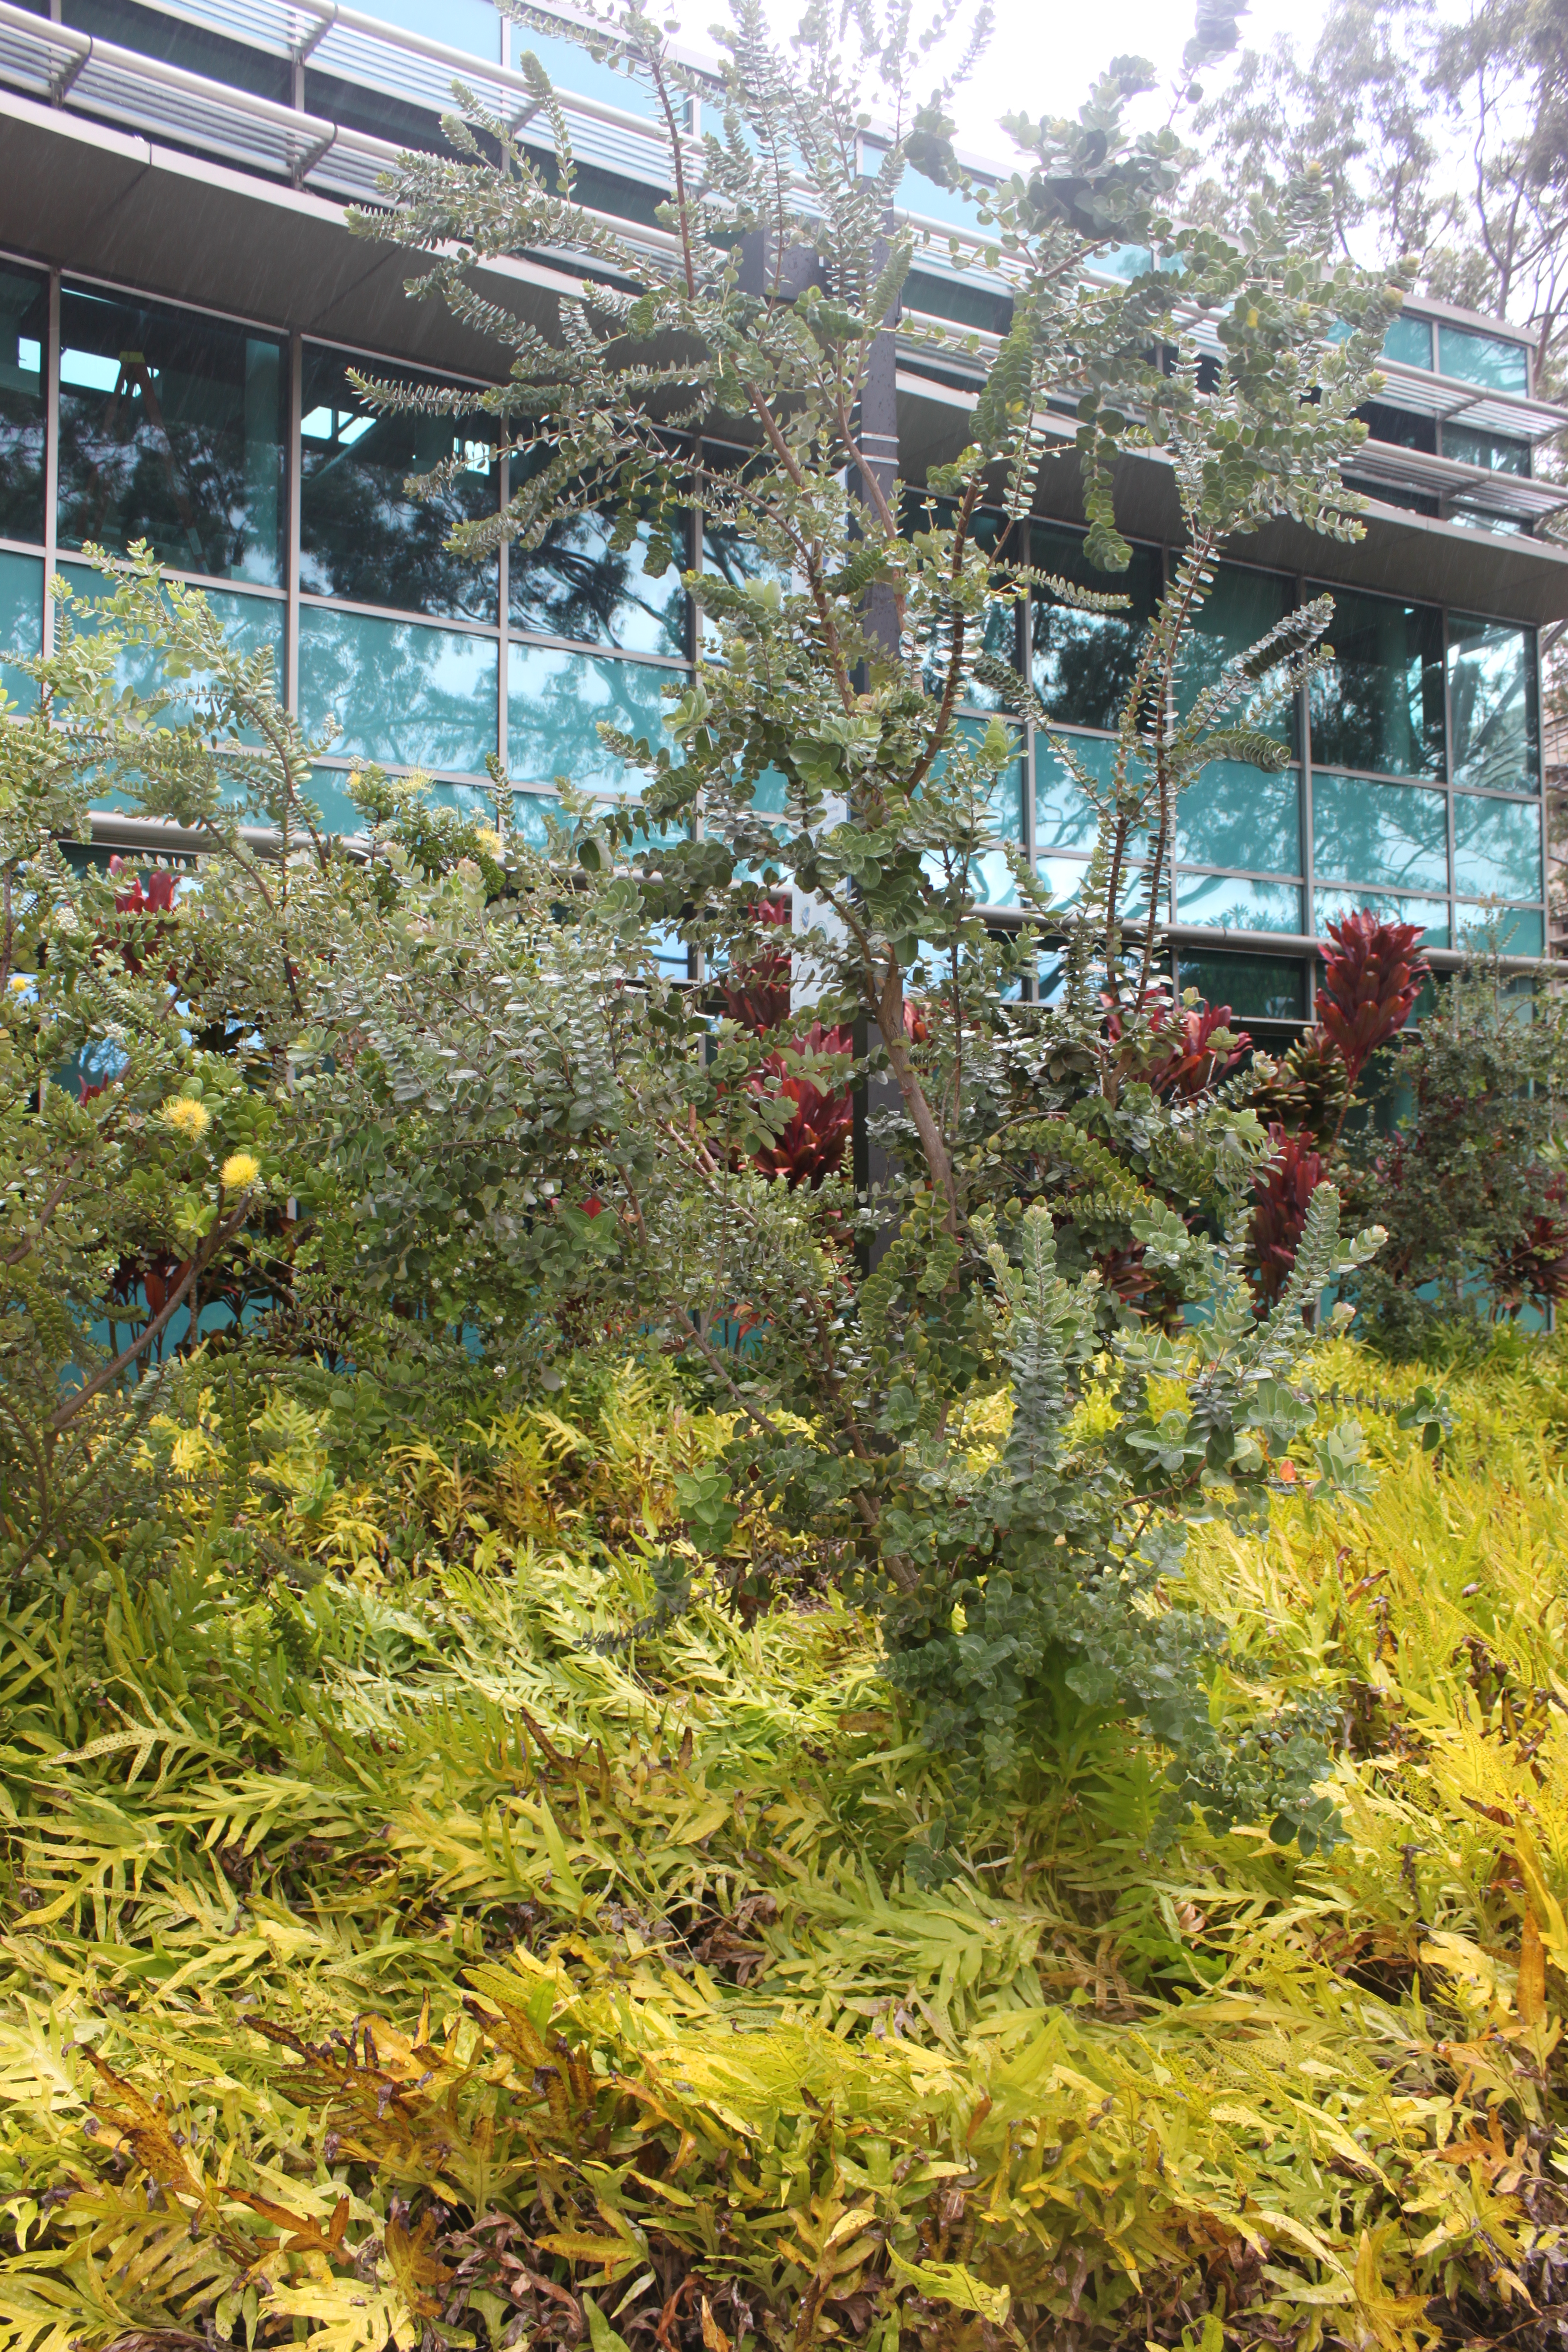
There are plants with red flowers (with darker leaves and stems) and ones with yellow flowers (with lighter leaves and stems).
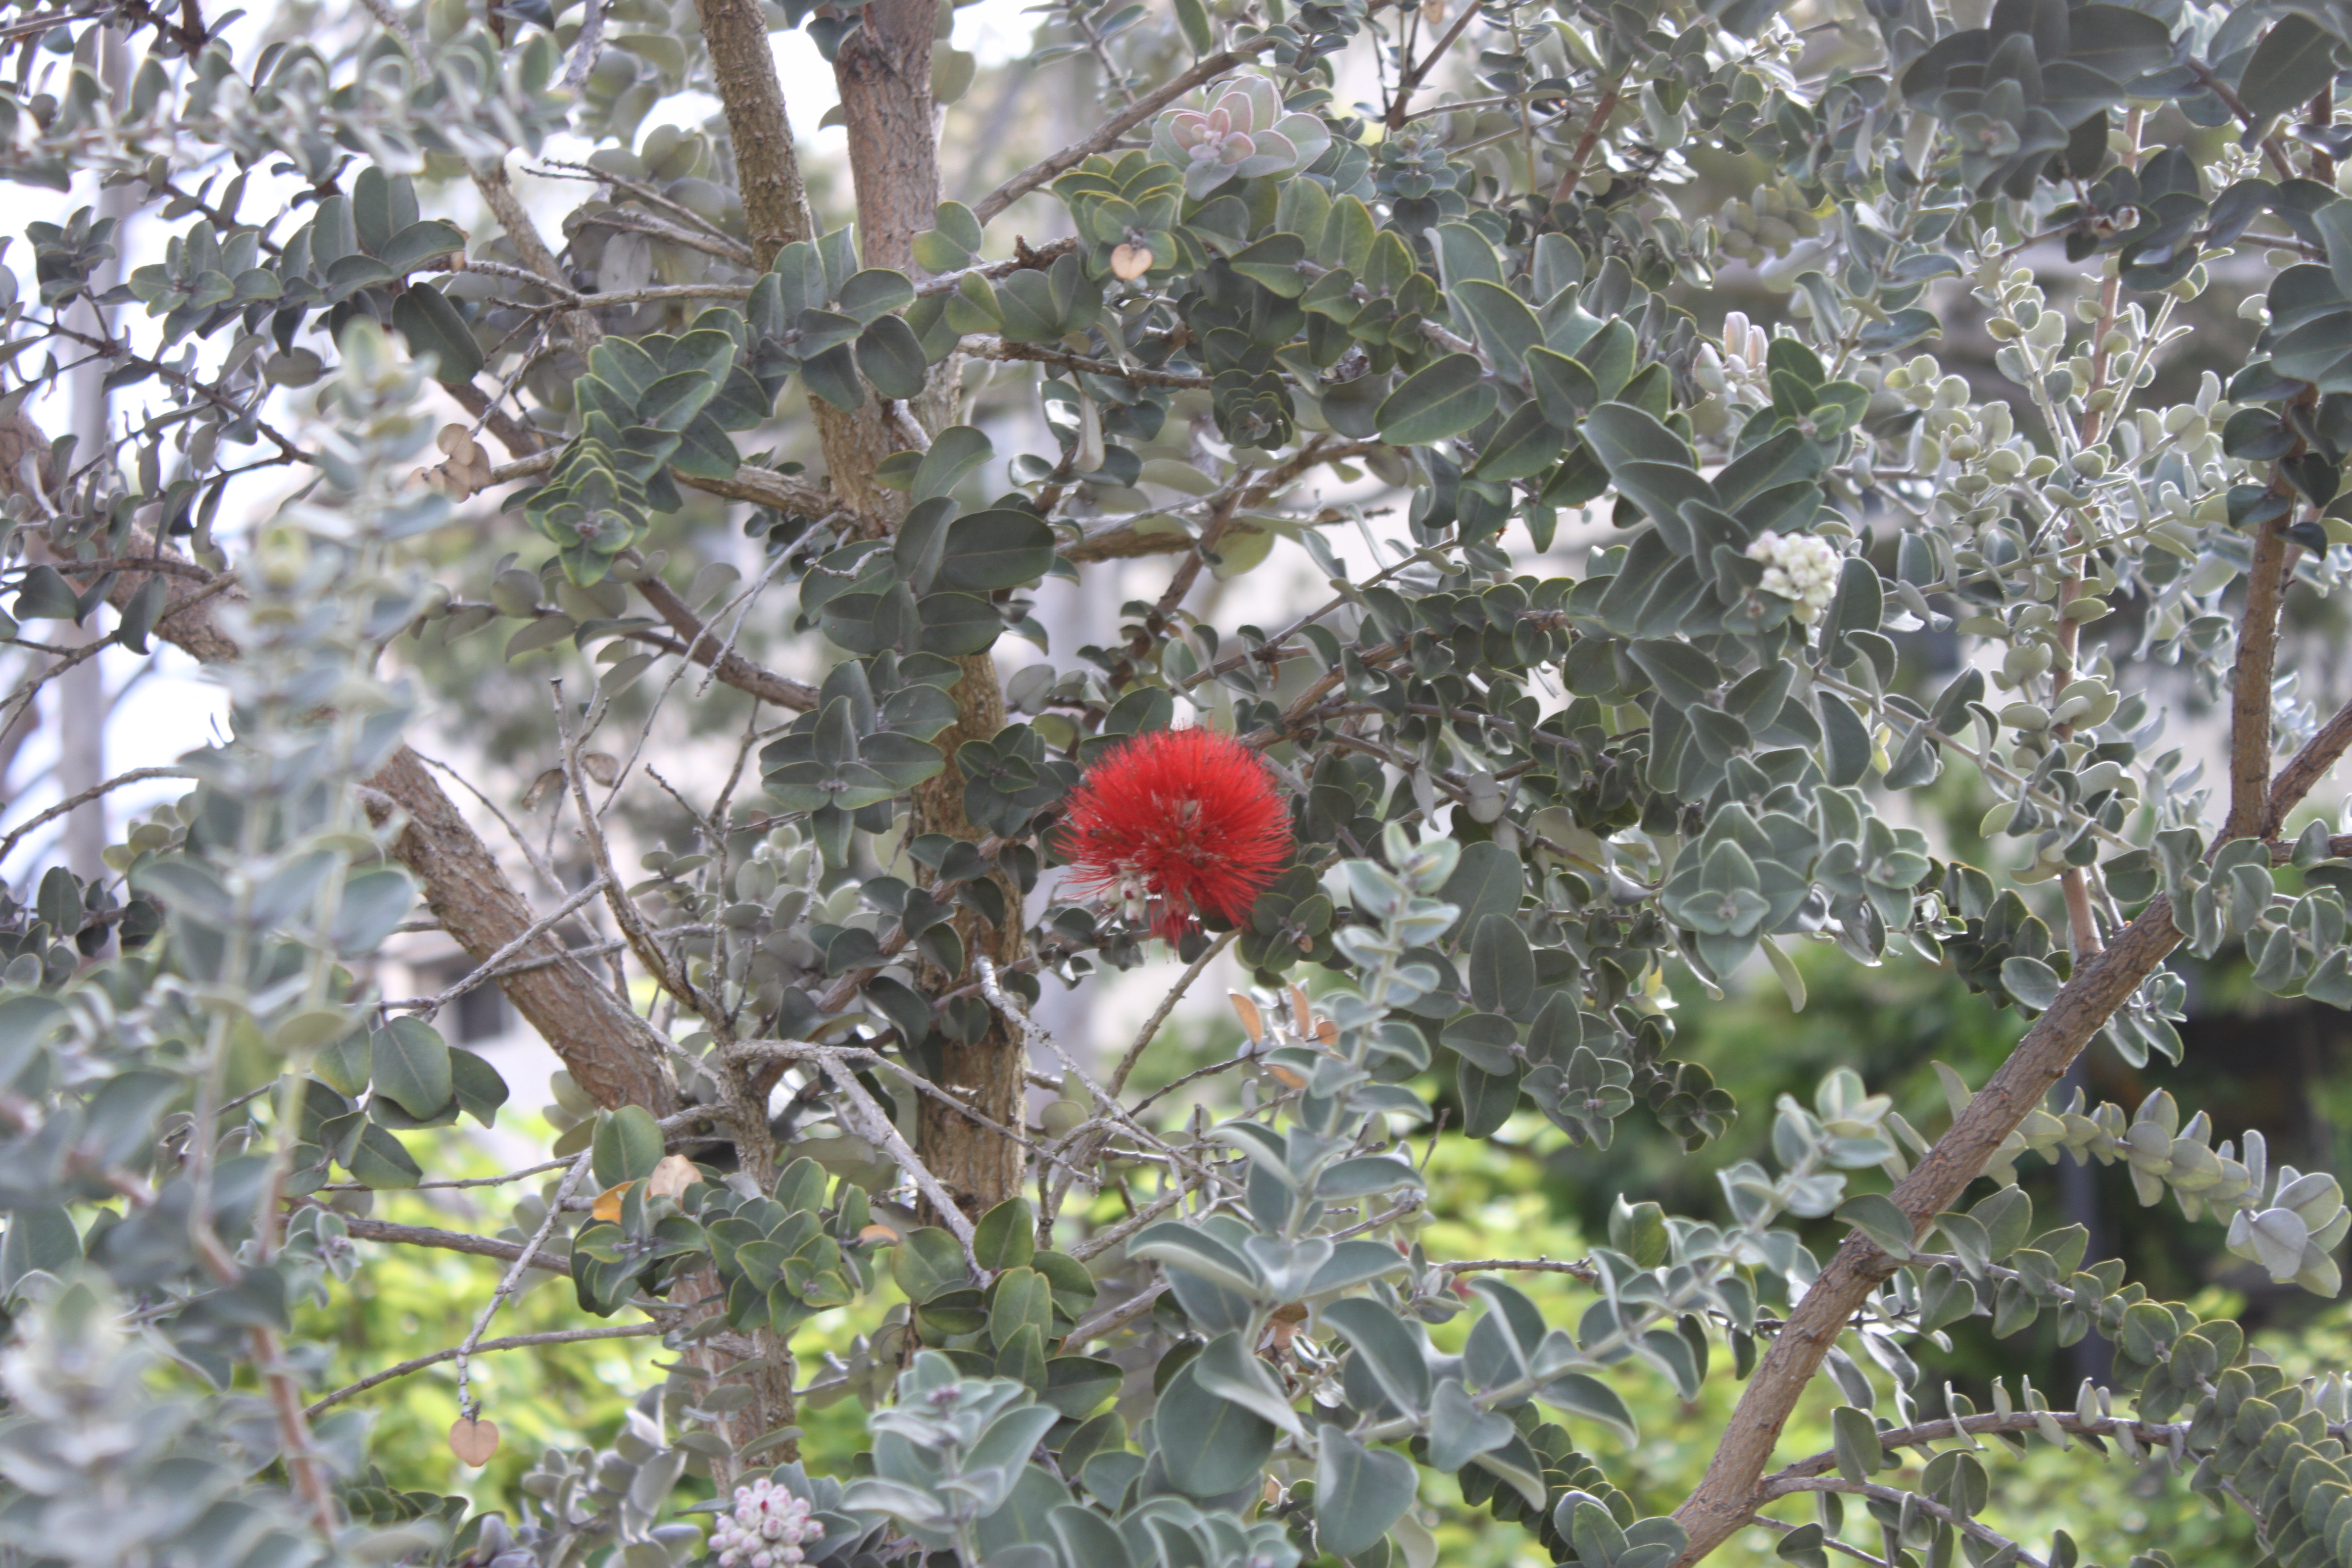
One of the students here told me that her grandmother said if you pick the flowers from a lehua it will rain.
I took a small leaf sample for extracting DNA and some samples from three other plants for comparison. I planned to amplify and sequence a small segment from the chloroplast genome. Like the mitochondria, the chloroplast has a small genome that is a loop of DNA. It is much larger than the mitochondria but much smaller than the nuclear genome (which contain the linear chromosomes we are used to thinking of) of plants and animals. Of course the chloroplast is well known as the site of photosynthesis in the plant but it also carries out other functions. Here is a representation of the chloroplast genome from the cotton plant and then zooming in on a section of the rbcL gene (in the lower right) for sequencing.
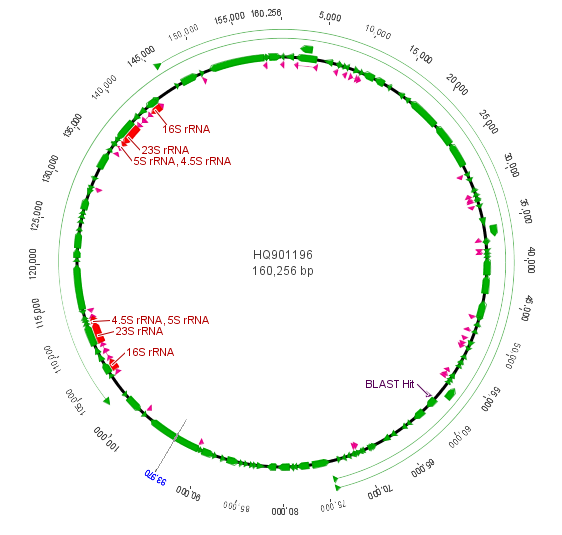
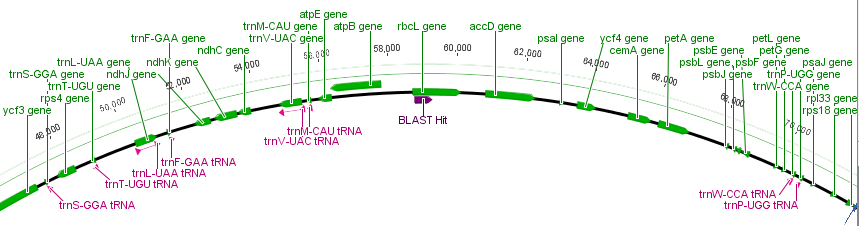
The purple "BLAST Hit" is the section sequenced. If you look back a few posts at the mitochondrial genome you can see that there are many more genes and the chloroplast genome is quite a bit larger.
A close comparison that happened to be around was a Chinese Hibiscus (Hibiscus rosa-sinensis).

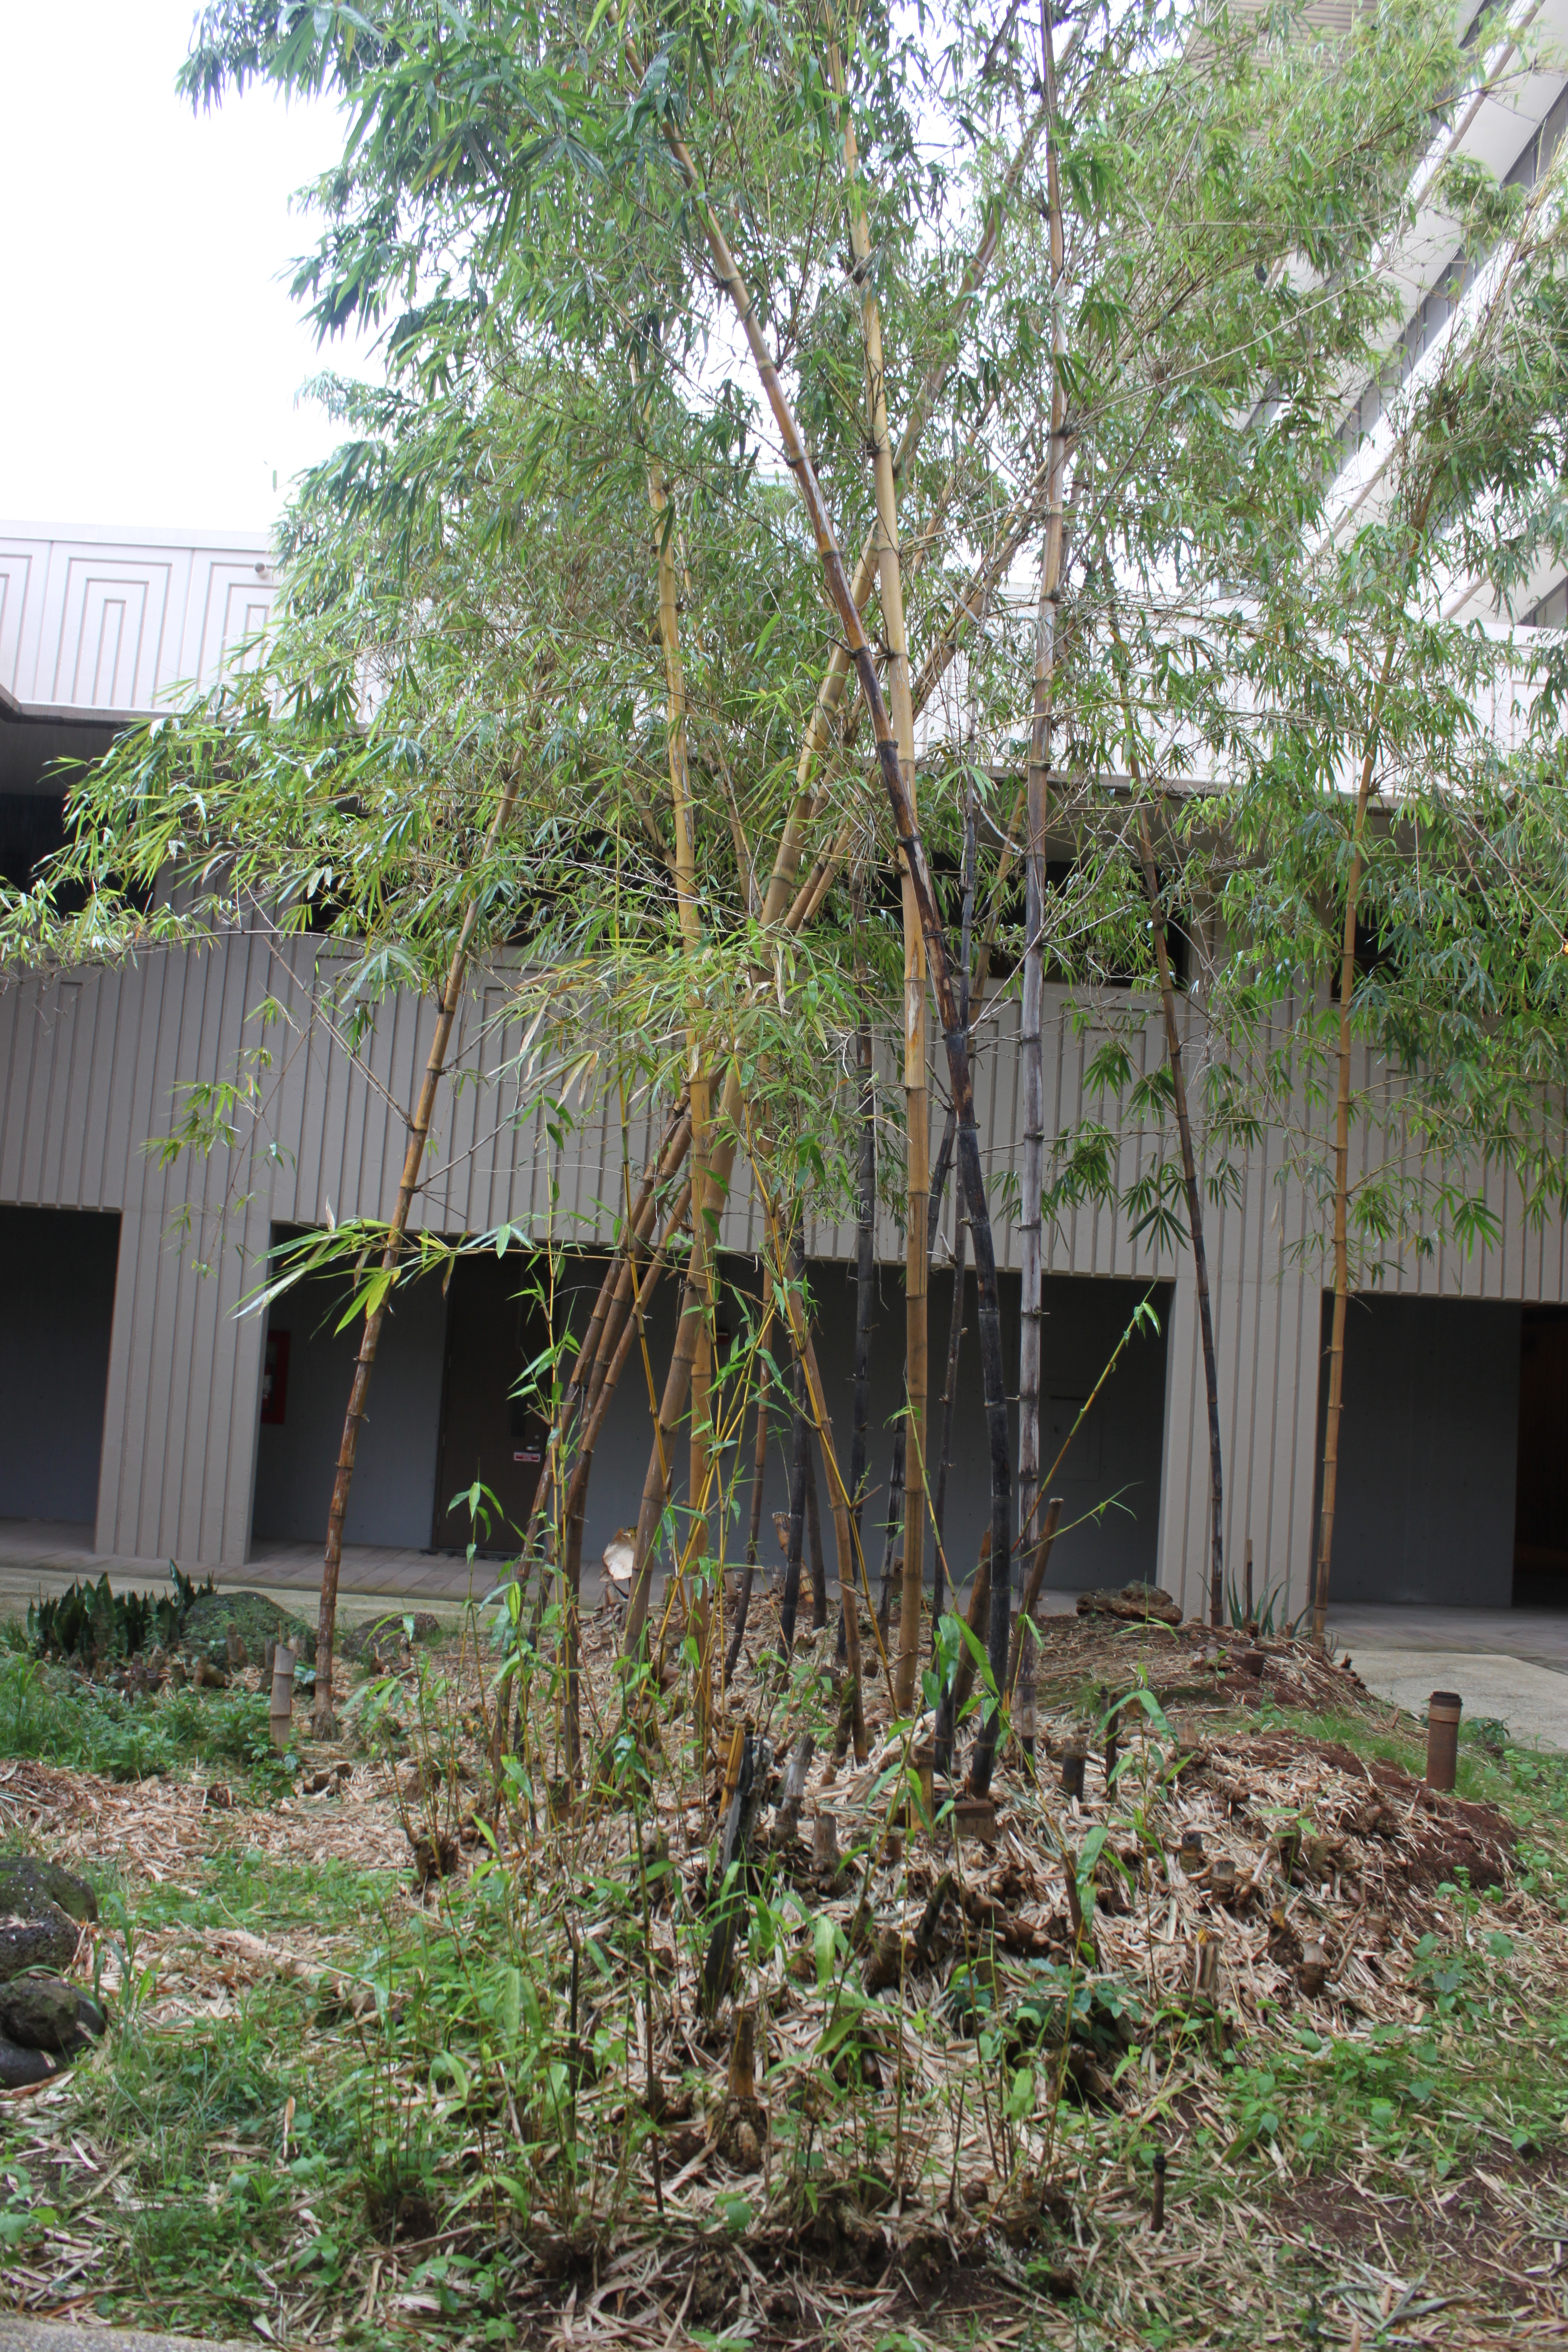
The lehua and the hibiscus are both dicot plants. Moving further out is the golden bamboo (Bambusa vulgaris) which is a monocot but still an angiosperm (flowering plant).
For an even more distant relative of lehua I took a sample from the wart ferns (Microsorum scolopendria) growing around their base.

Like many plants M. scolopendria ferns were introduced to Hawai'i and they have now esabilshed themselves in the wild here. They are called "wart" ferns because of the spore clusters on the leaves.
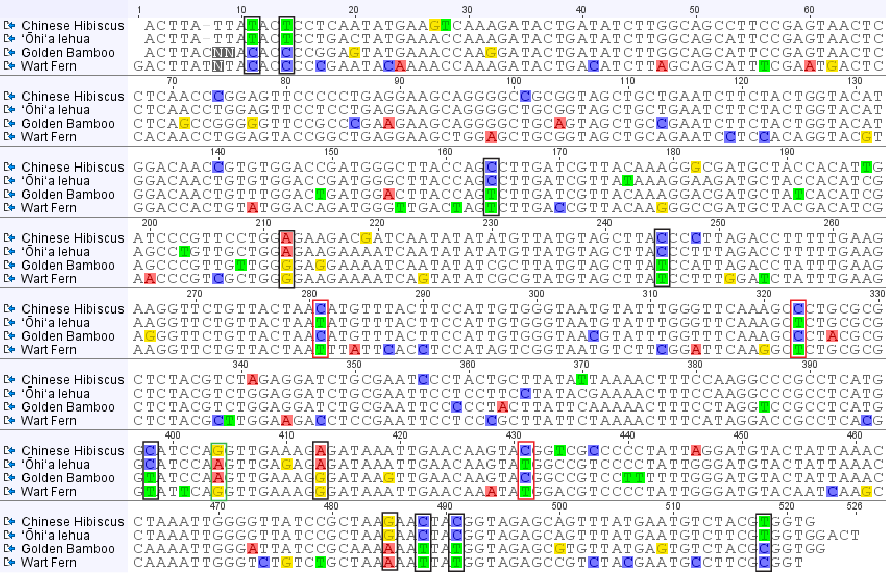
So here is what the alignment of the chloroplast DNA sequences from these four species of plants looks like.
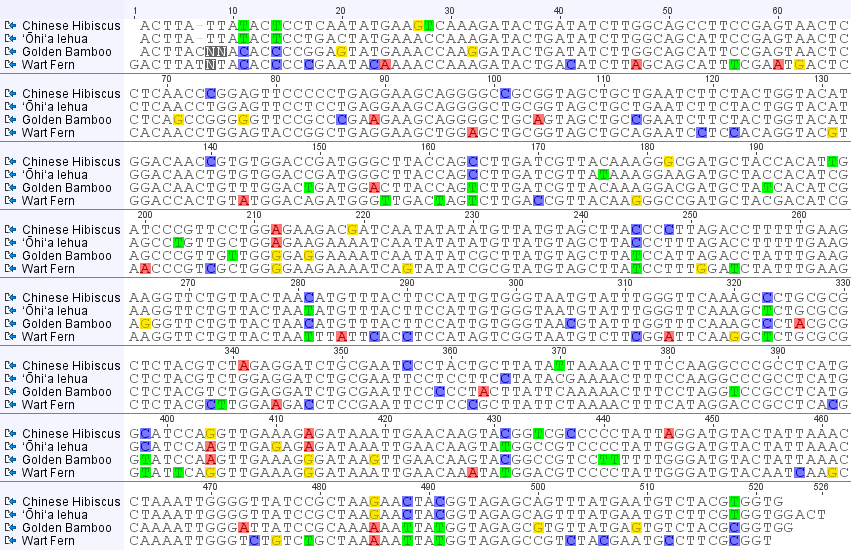
Most DNA positions that vary between the samples are highlighted (but if you look closely not all are; I used geneious software to make this plot; this might be a bug or, more likely, I have a highlighting setting wrong.). One thing that is quickly apparent is the large number of unique nucleotides in the wart fern sequence. This can be explained because the fern is so divergent from the other species. You can also see that when a DNA difference is shared between only two species (like position 11 near the beginning), it tends to be shared between the lehua and hibiscus, the two most closely related species among these four. Overall the unique sites and shared sites give this type of "tree" representation. (Shared derived (derived means different from a common ancestor) states are useful for reconstructing ancestral relationships between divergent species and are called synapomorphies.)
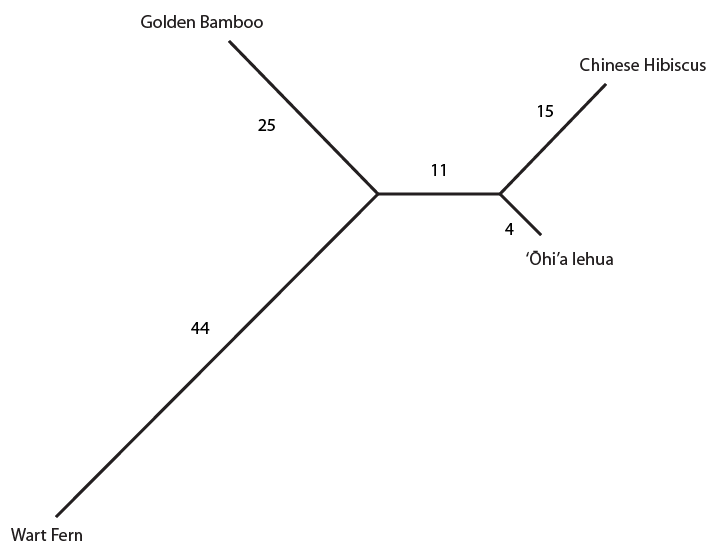
The numbers along each branch indicate the unique DNA basepair differences highlighted for each species (there are actually some more upon closer inspection that were not highlighted, as I mentioned above, but I left it as it is for now). The "11" in the segment separating the lehua and hibiscus from the other plants represent the 11 differences (synapomorphies) only shared by these two species.
However, there are some sites that do not share this pattern. For example, site 404 places lehua with bamboo and site 281 places lehua with the fern. Here is the alignment with the 11 shared sites mentioned above outlined in black, and the sites that are incongruent with the actual relationship of these species indicated in red or green (for the two different incongruent patterns present).
And below the incongruent sites are indicated on the tree with dashed arrows.
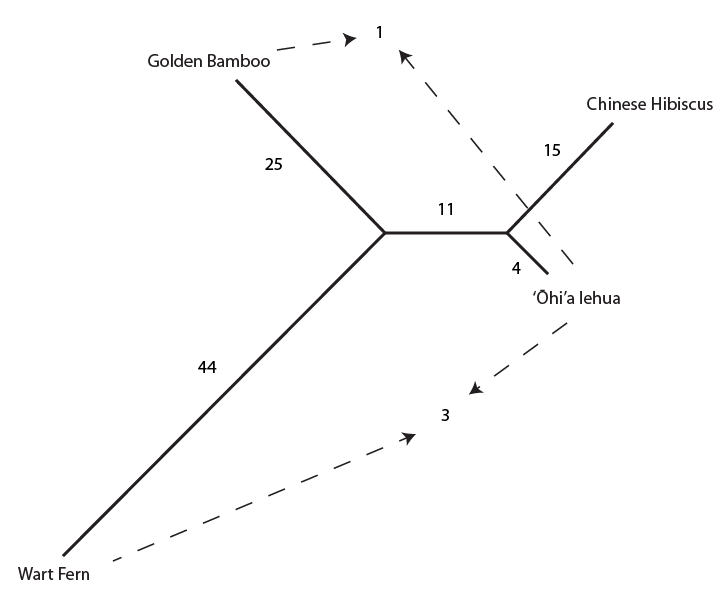
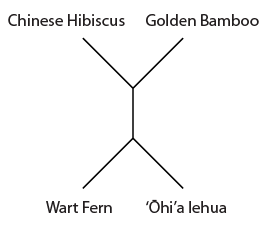
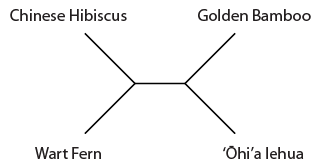
Overall the data suggests the grouping that we believed to be true a priori (based on observable physical characteristics of the plants), that the lehua and hibiscus are more closely related. But one DNA position suggests a closer relationship between the lehua and bamboo and three positions push the lehua closer to the ferns. This gives some level of support for the following two alternative tree topologies.
However, a far more likely explanation is that these DNA positions experienced more than one mutation event that resulted in parallel mutations to the same state in different lineages (or even a "back" mutation to an ancestral state after a lineage seperation.) This sharing of states from different events is termed homoplasy. Because of the long evolutionary distances between these species it is reasonable to suspect a few sites have had multiple "hits;" also, if you look closely, a few sites like position 20 and 149 have had multiple mutation events to more than two states (but these have not been highlighted by the software I used to make the plot).
If we believe the wart fern is the most divergent, we can use this assumption to "root" the tree by using the fern as an "outgroup." In this simple representation time moves from left to right; the older part of the tree is to the left and the younger is to the right. (This plot is just to represent the relative order of events, the branch lengths here are not proportional to the amount of change or inferred time period.)

In the image below a past mutation even from an "A" to a "G" in the bamboo linage (for example position 32 in the alignment) is mapped onto the tree. This is a single (not shared) derived state (an autapomorphy) so it is not useful for inferring ancestral relationships, but it gets the ball rolling with thinking about mapping mutations onto a tree.
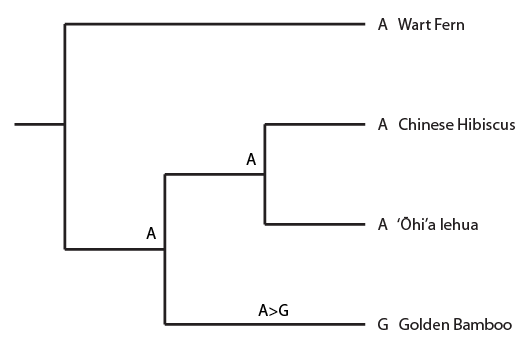
The state of the DNA position is given at the tips of the tree in front of each species name (resulting in a "G" in the bamboo sequence) and at two positions inside the tree where we can infer the sequence of a common ancestor. Now for the synapomorphy pattern:
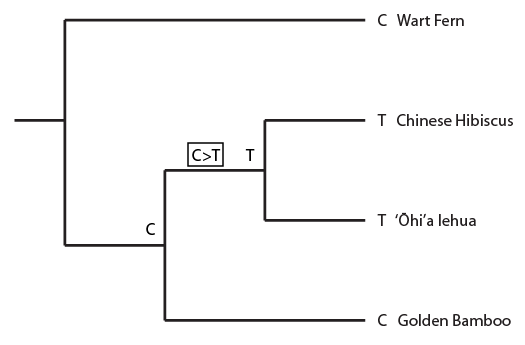
Above the history of position 11 in the alignment is indicated. A C to T mutation occurred before the common ancestor of the hibiscus and lehua but after the species split from the lineage leading to the bamboo (indicated in the black box as in the alignment). And now I'll plot a homoplasy pattern that gives incongruent results.
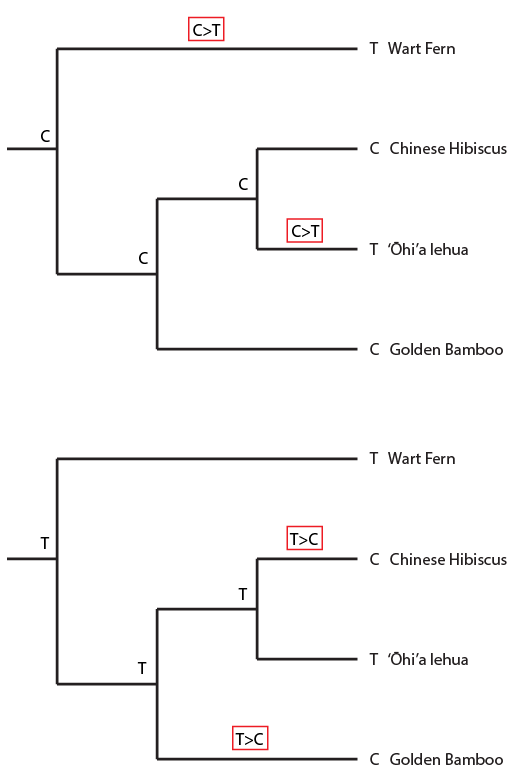
Here is an example from position 281 in the alignment. The lehua and fern share one state and the hibiscus and bamboo share the other. In this case we suppose that more than one mutation event has occurred in the history of this position, but based on only this data we cannot tell when/where it occurred, what direction it was in (a T to C or a C to T), or what the ancestral states were likely to be.
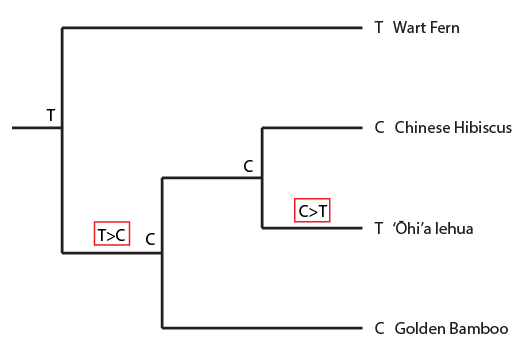
And here is yet another possibility where a back-mutation occurred along a lineage to restore an ancestral state.
This example helps illustrate that often in biology we deal with some level of uncertainty; but this does not necessarily prevent us from being able to make inferences. Also, assumptions are important tools to use to work through a problem, so long as we are clear about what those assumptions are. The four species used in this example cover a long range of evolutionary time. There is plenty of opportunity for multiple mutations to occur. When looking at closer related species there is often far less uncertainty (of the kind discussed here, homoplasy, for this type of gene--there are other types of issues with closely related datasets). This data also provides a "backbone" tree to place other plants onto as I collect more samples.
Pingback: Eight-Species Plant DNA Alignment | Reed Lab Blog